
[[{“value”:”
More people, more workers, higher incomes, more spending. Banks eager to lend at high rates and collect swipe fees.
By Wolf Richter for WOLF STREET.
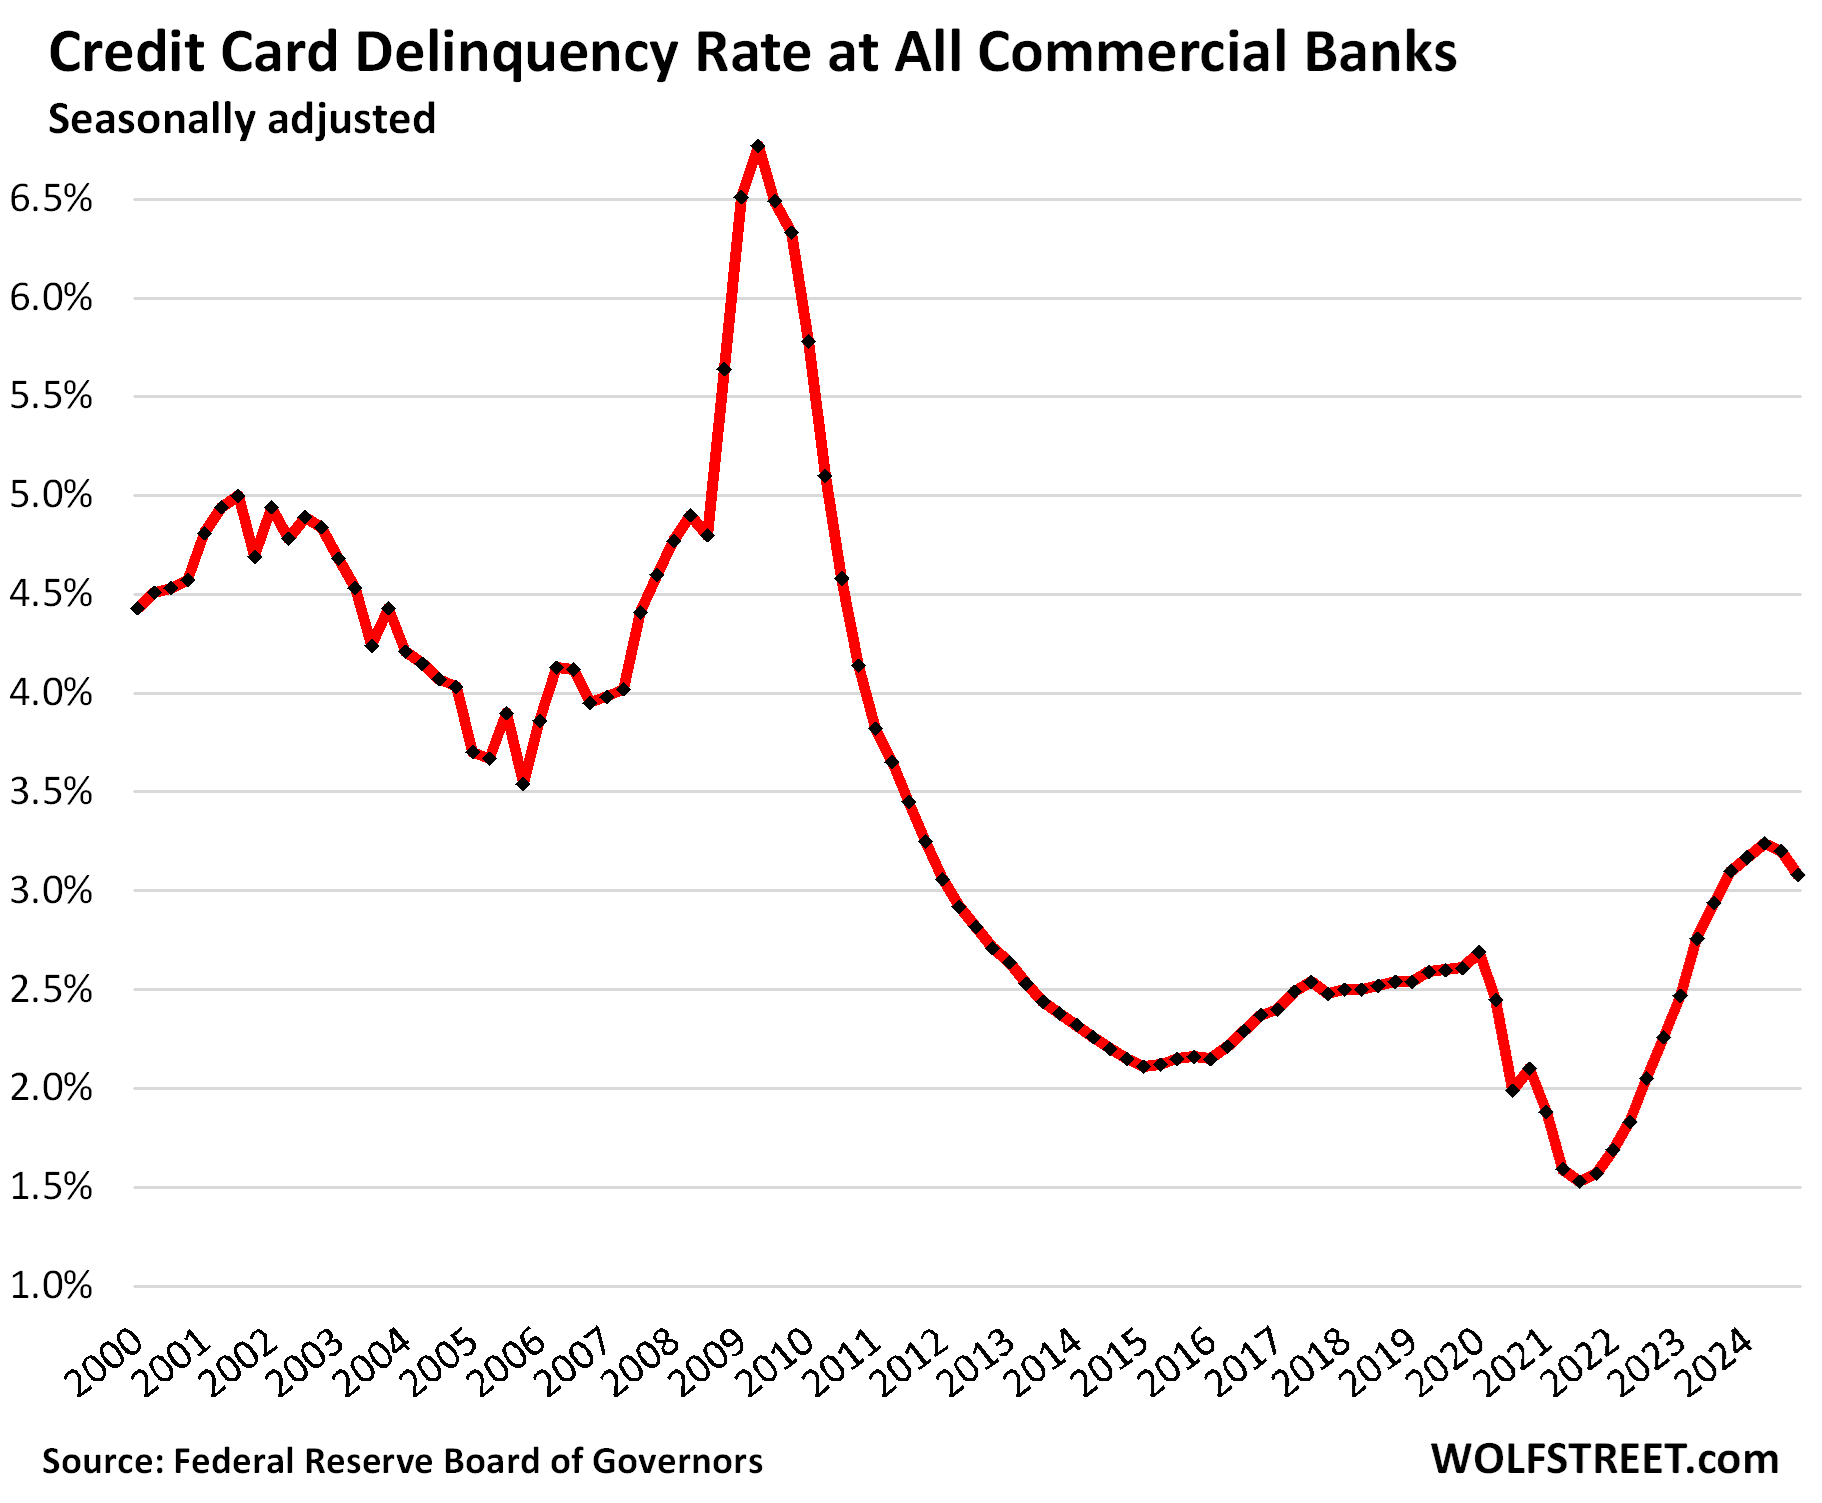
Delinquency rates for credit cards 30 days or more past due declined for the second quarter in a row, to 3.08% of total credit-card balances at all commercial banks at the end of Q4, seasonally adjusted, according to Federal Reserve data on yesterday. This includes credit cards issued to prime and subprime-rates borrowers.
The plunge in delinquencies during the pandemic was a result of Free Money flooding households which helped some folks get caught up; and it was also driven in part by limited options of spending, with restaurants, flights, cruises, entertainment venues, etc. being largely shut down.
Then the spending boom took off, the Free Money ended, and delinquency rates normalized, then overshot a little. The high point was in Q2 last year (3.24%), and the delinquency rate has dropped since then:
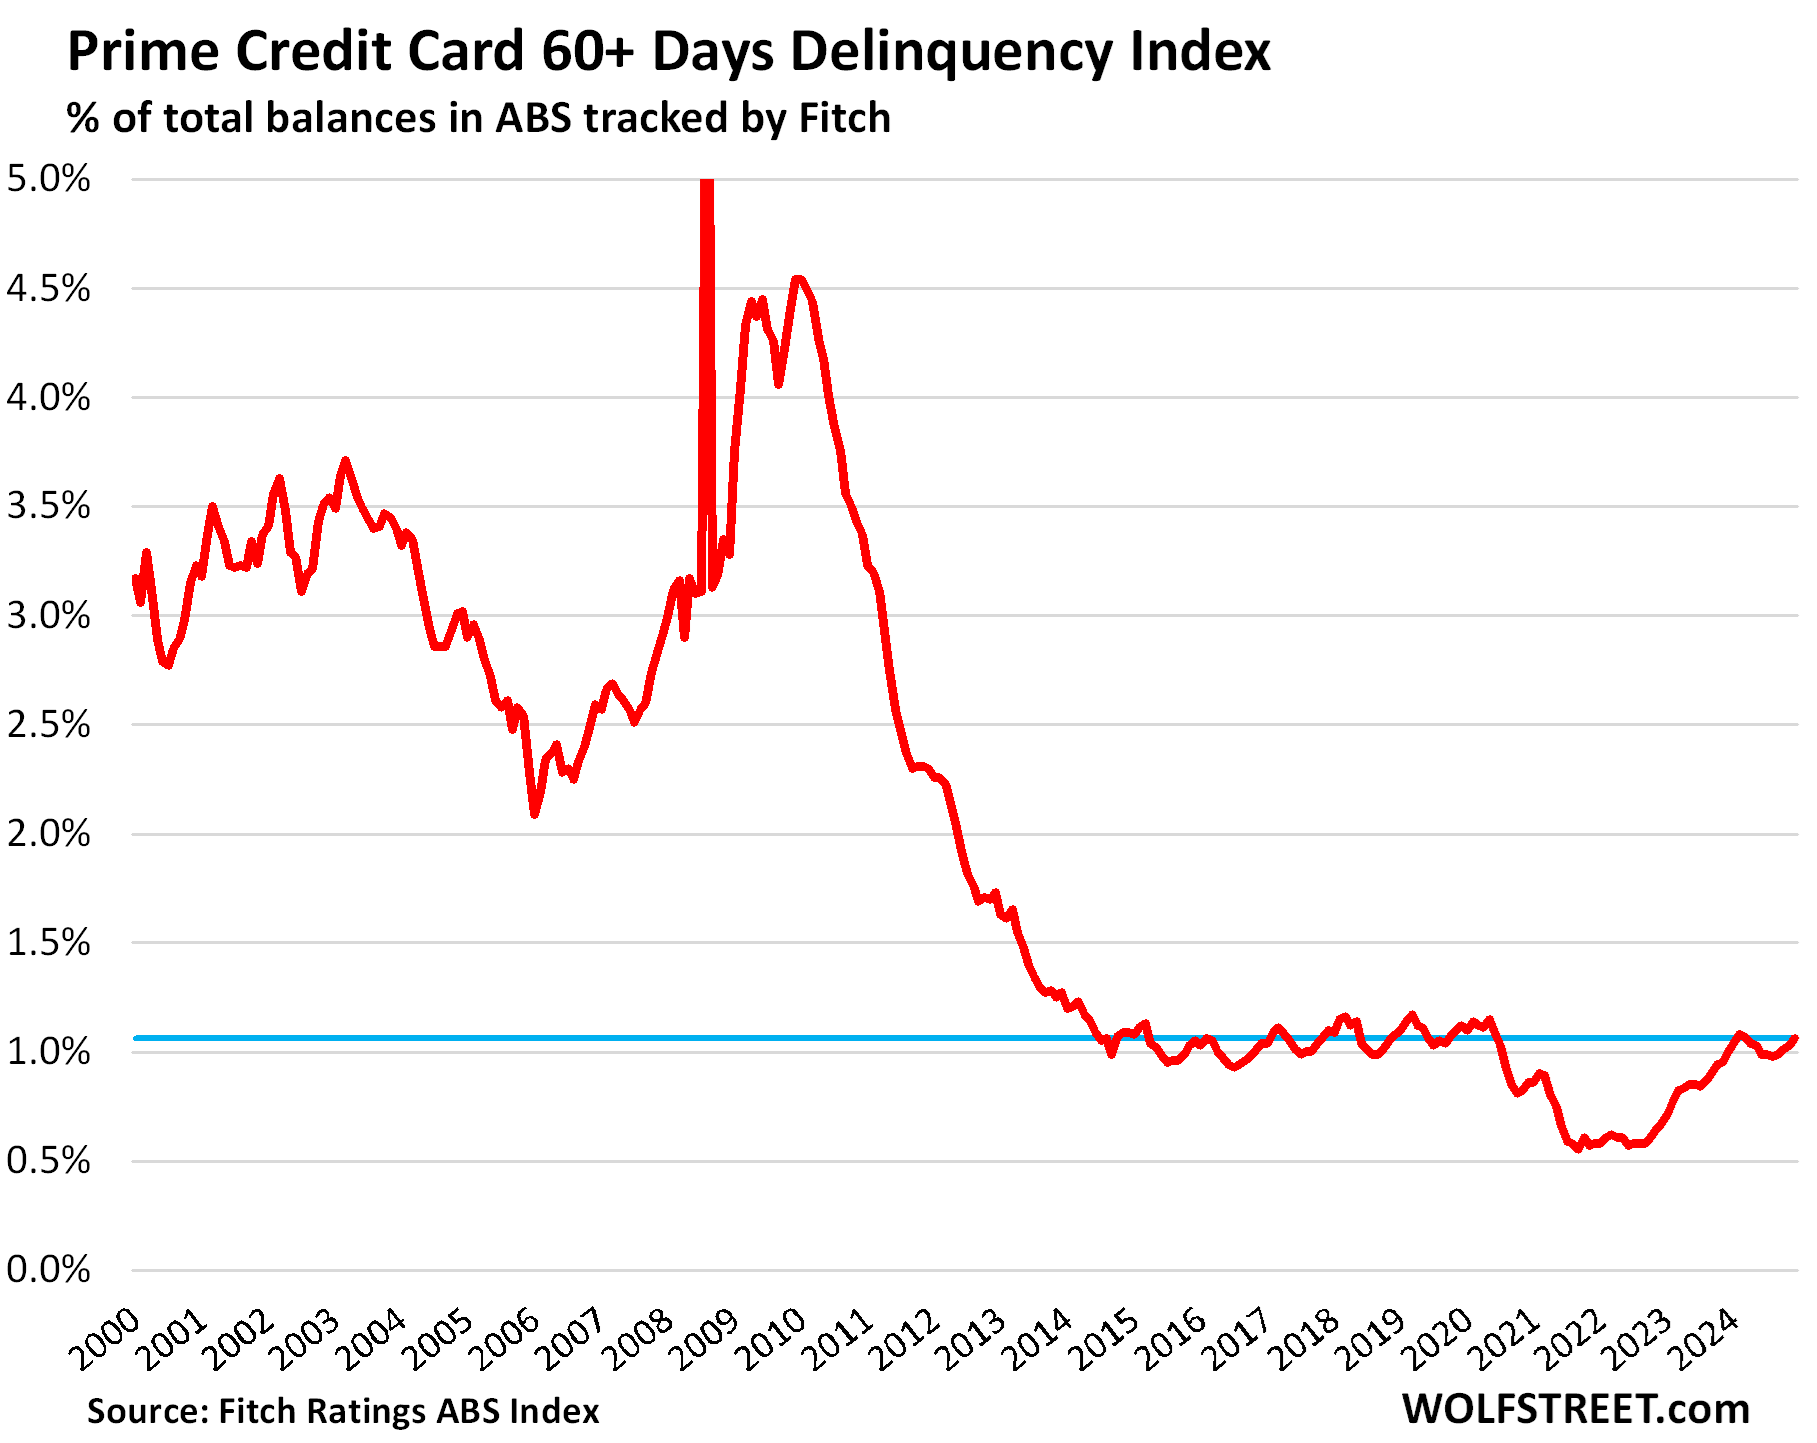
For prime-rated cardholders, delinquencies of 60-plus days have hovered at around 1%, sometimes a little under sometimes a little over, not seasonally adjusted, right where they had been before the pandemic, according to data from Fitch Ratings, which tracks the performance of Asset Backed Securities (ABS) backed by prime credit card balances.
Credit Card Balances are a measure of spending, not of debt.
Credit cards are the dominant payment system in the US, and credit card statement balances therefore are a measure of spending – including for expensive business trips that are reimbursed.
They’re not a measure of borrowing because most balances are paid off by due date and never accrue interest, but allow cardholders to get their 1% or 2% cashback, airmiles, and other loyalty benefits.
Of the roughly $6 trillion a year that flow through credit cards, only a small portion doesn’t get paid off every month by due date. Credit card balances that are “revolving” – meaning becoming an interest-bearing loan – amounted to $645 billion at the end of Q3, according to the Philadelphia Fed’s report in January. Big-ticket items, such as furniture to equip the new house, are a common example of balances getting run up that then get paid off over the next few months.
Lower-income people rarely have access to credit cards, and usually have to make do with debit cards, or if they have access to credit, the credit limits are low. So in aggregate, they cannot run up the revolving balances; it’s the young high-income dentist with five credit cards, each with a $30,000 credit limit, that can a dent into those balances.
More people, more workers, making more, spending more.
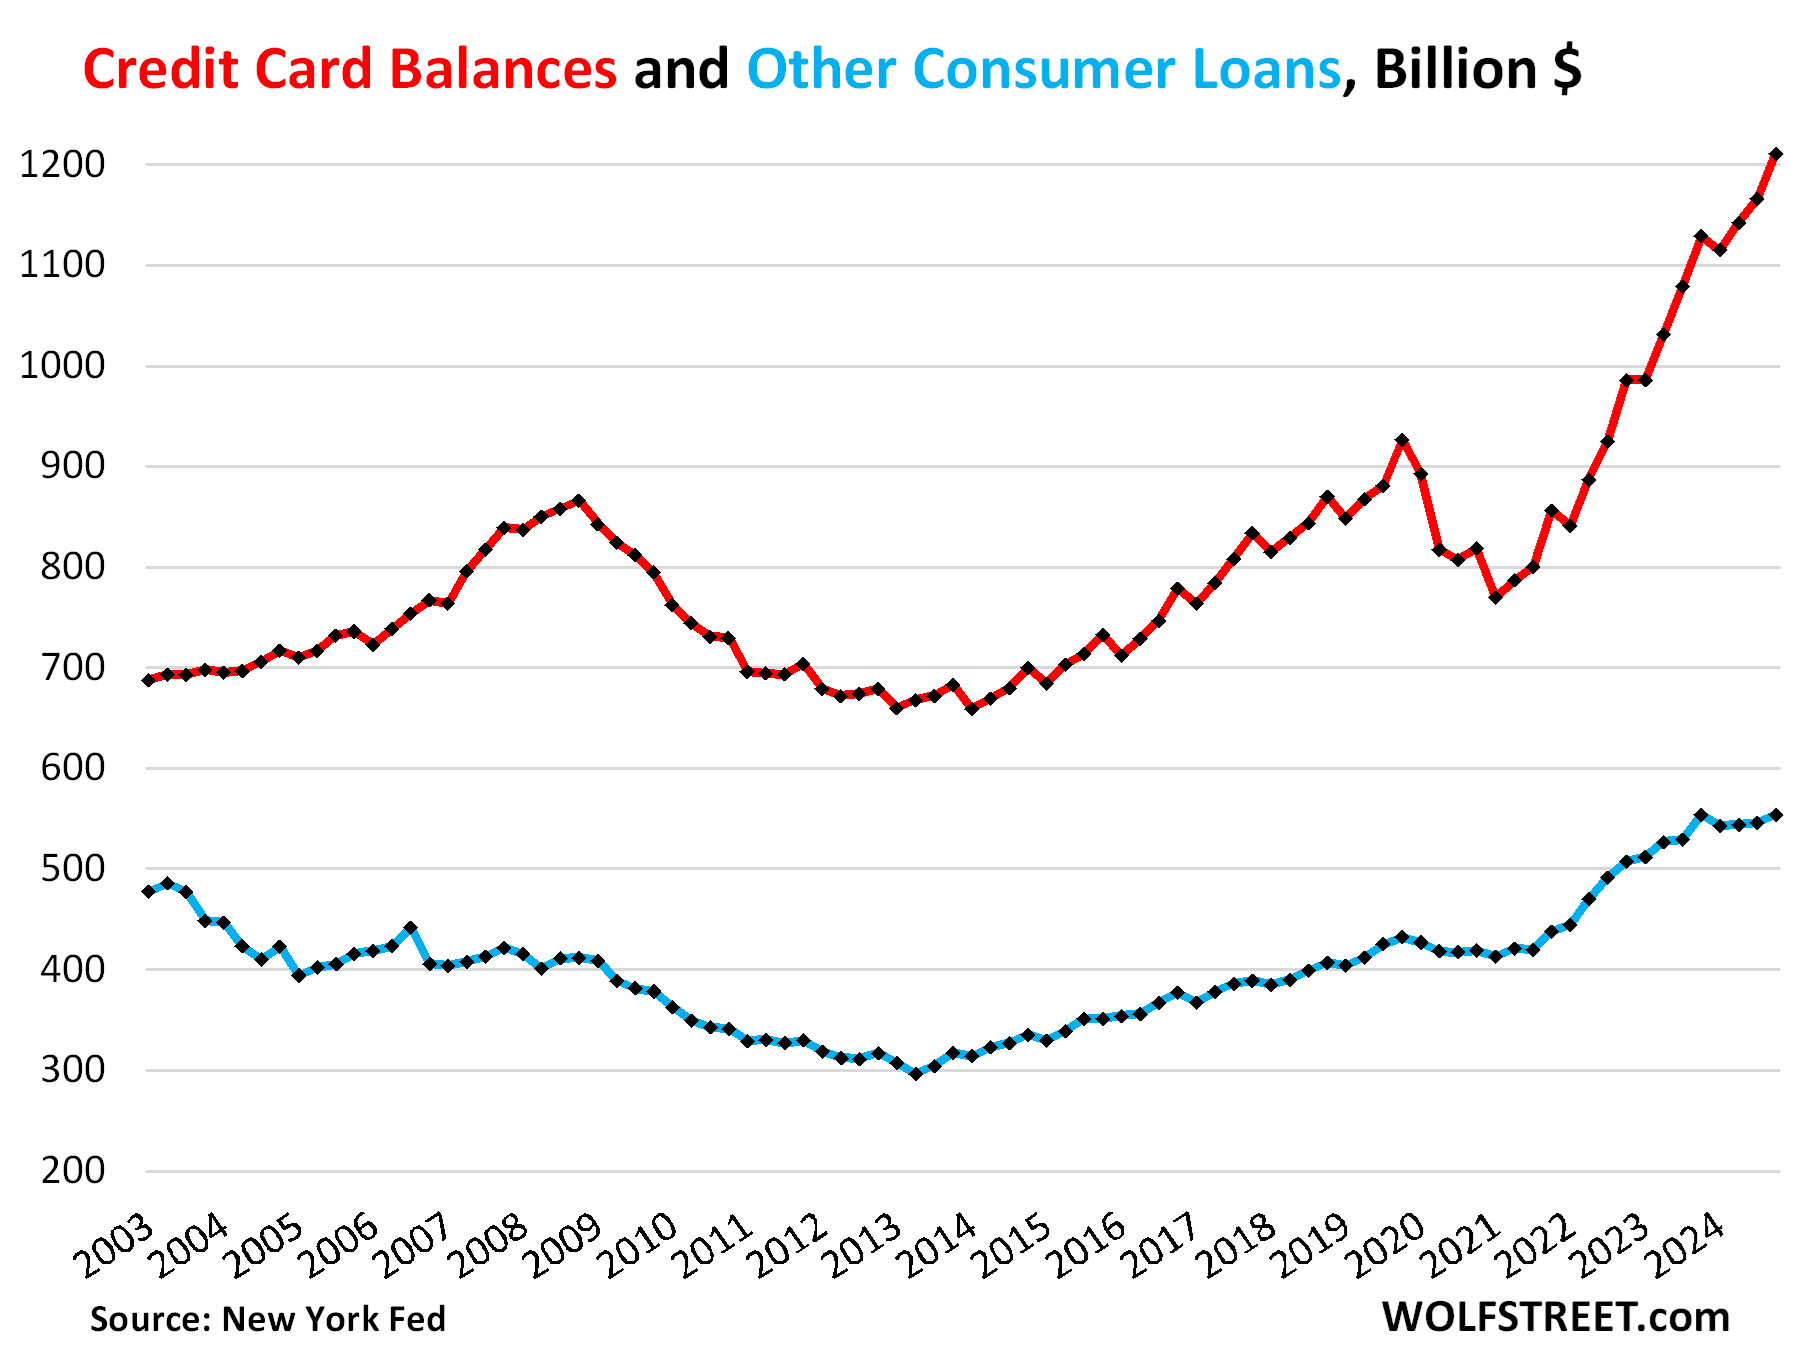
Credit card statement balances rose by $45 billion, or 3.9%, at the end of Q4, not seasonally adjusted, to $1.21 trillion, according to the NY Fed’s Household Debt and Credit Report, after blockbuster holiday spending by our Drunken Sailors, as we’ve come to call them lovingly and facetiously. Year-over-year, statement balances were up 7.3% — more people, more workers, making more money, and spending more.
“Other” consumer loans, such as personal loans, payday loans, and Buy-Now-Pay-Later (BNPL) loans remained unchanged year-over-year, at $554 billion (blue line).
BNPLs are subsidized by the merchant and are interest-free for the consumer, if they stick to the plan. Merchants like them because the fees can be lower than credit card swipe fees.
Combined, credit card balances and “other” consumer loans rose by 3.1% in Q4 from Q3 and by 4.9% year-over-year, to $1.76 trillion.
The credit-balance-to-income ratio.
The burden of debt on households – accounting for more people, higher employment, and higher incomes – can be tracked with the debt-to-disposable-income ratio, a classic measure of the borrowers’ ability to deal with the burden of debt.
Over the past 20 years, disposable income has surged by 144%, a result of higher employment with workers making more money on average, while balances of credit cards and “other” consumer loans combined has risen by only 58%.
Disposable income, released by the Bureau of Economic Analysis, represents an after-payroll-tax cashflow from all income sources: Household income from after-tax wages, plus income from interest, dividends, rentals, farm income, small business income, transfer payments from the government, etc. This is the cash consumers have available every month to spend on housing, food, debt payments, etc. But it excludes capital gains.
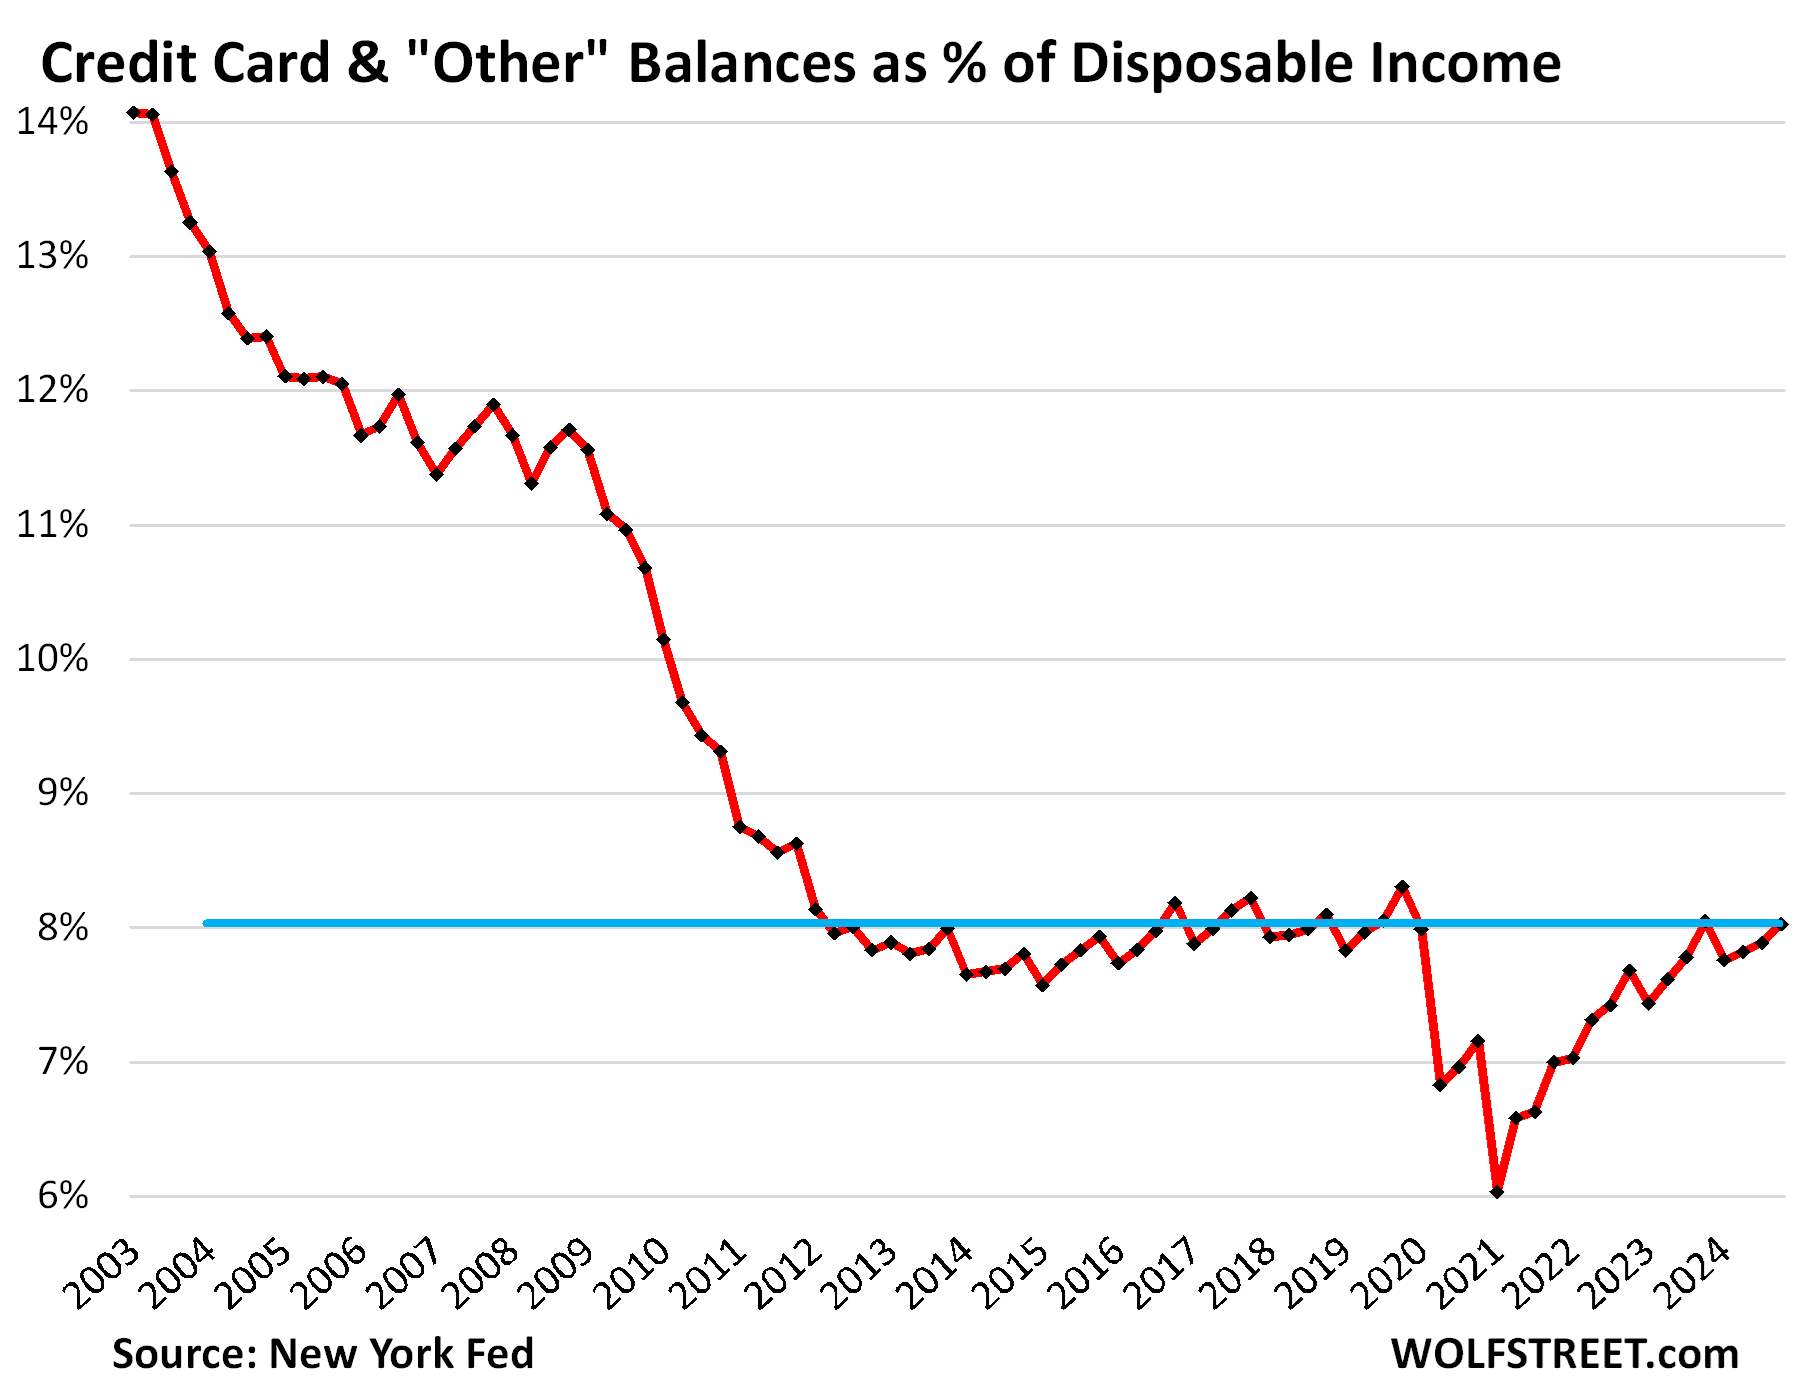
In Q4, driven by holiday spending, statement balances are always higher, and then they dip in Q1 as spending sags, seasonally. These balances are not seasonally adjusted:
- In Q4 from Q3: credit balances +3.1%, disposable income +1.3%.
- Year-over-year: credit balances +4.9%, disposable income +5.1%.
As a result, the burden of the combined credit card balances and “other” balances, in terms of the debt-to-disposable-income ratio, increased quarter to quarter due to the seasonal spending burst, but declined year-over-year, and is very low by historical standards, as our Drunken Sailors have learned a lesson coming out of the Great Recession.
Banks eager to lend at high rates and earn swipe fees.
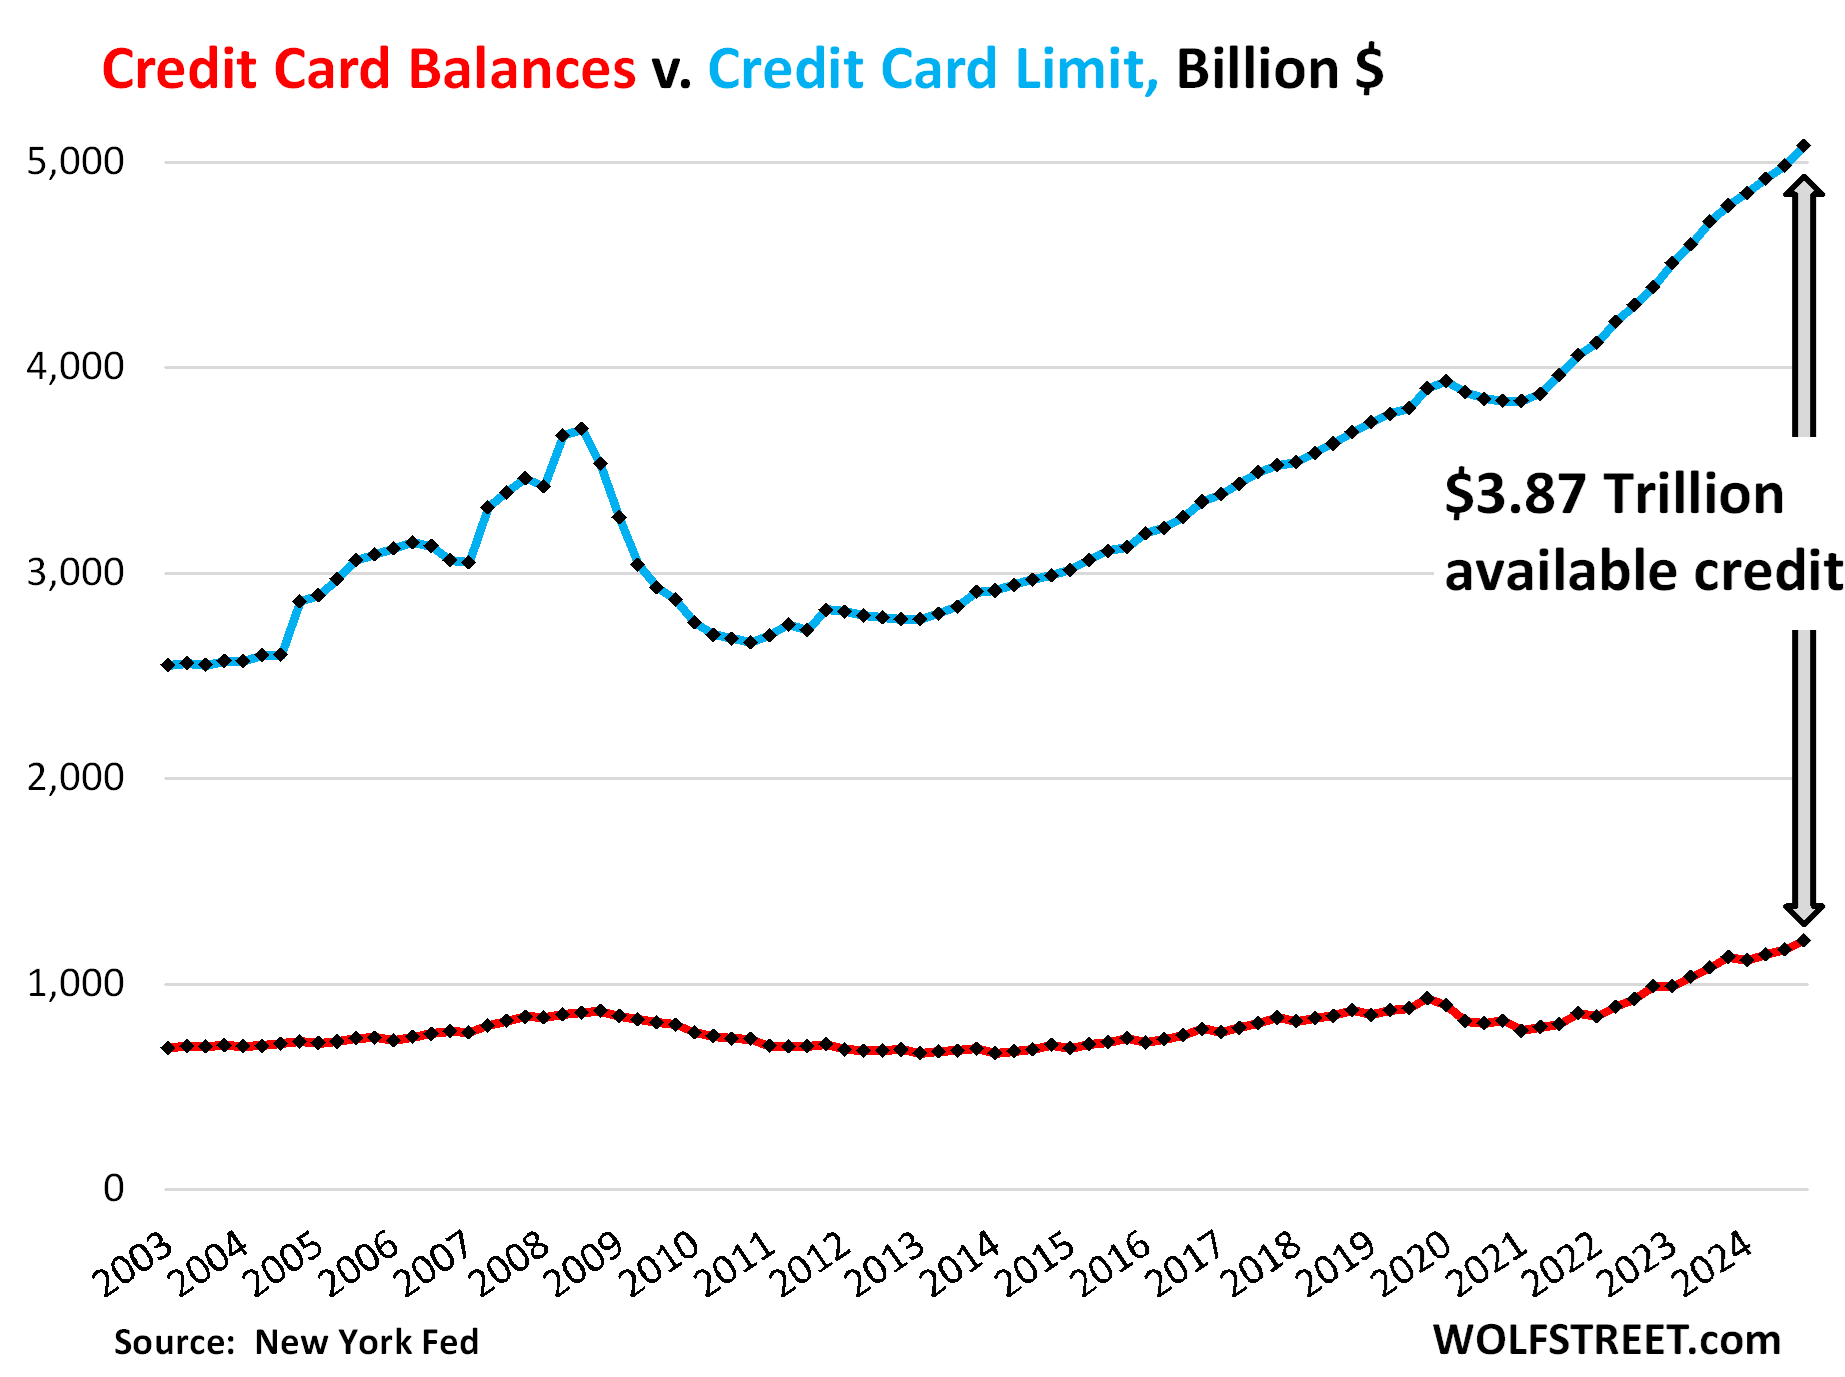
The aggregate credit limit rose by $269 billion year-over-year, to $5.08 trillion, as more card accounts were opened by more workers, and as credit limits were raised on existing cards (blue line).
Over the same period, credit card statement balances rose by $87 billion, to $1.21 trillion (red line)
And the available unused credit surged by $182 billion year-over-year, to a record $3.87 trillion. Following the Financial Crisis, credit tightened as banks were skittish, and available credit plunged by $1 trillion:
In case you missed the earlier parts of the debts of our Drunken Sailors and their debts in Q4:
Enjoy reading WOLF STREET and want to support it? You can donate. I appreciate it immensely. Click on the mug to find out how:

![]()
The post Our Drunken Sailors and their Credit Cards: Delinquencies, Balances, Burden, and Available Credit in Q4 2024 appeared first on Energy News Beat.
“}]]