
[[{“value”:”
Lennar’s average sales price drops to lowest since Q2 2020, gives up entire 2020-2022 price explosion. Homeowners wanting to sell have no idea what they’re up against.
By Wolf Richter for WOLF STREET.
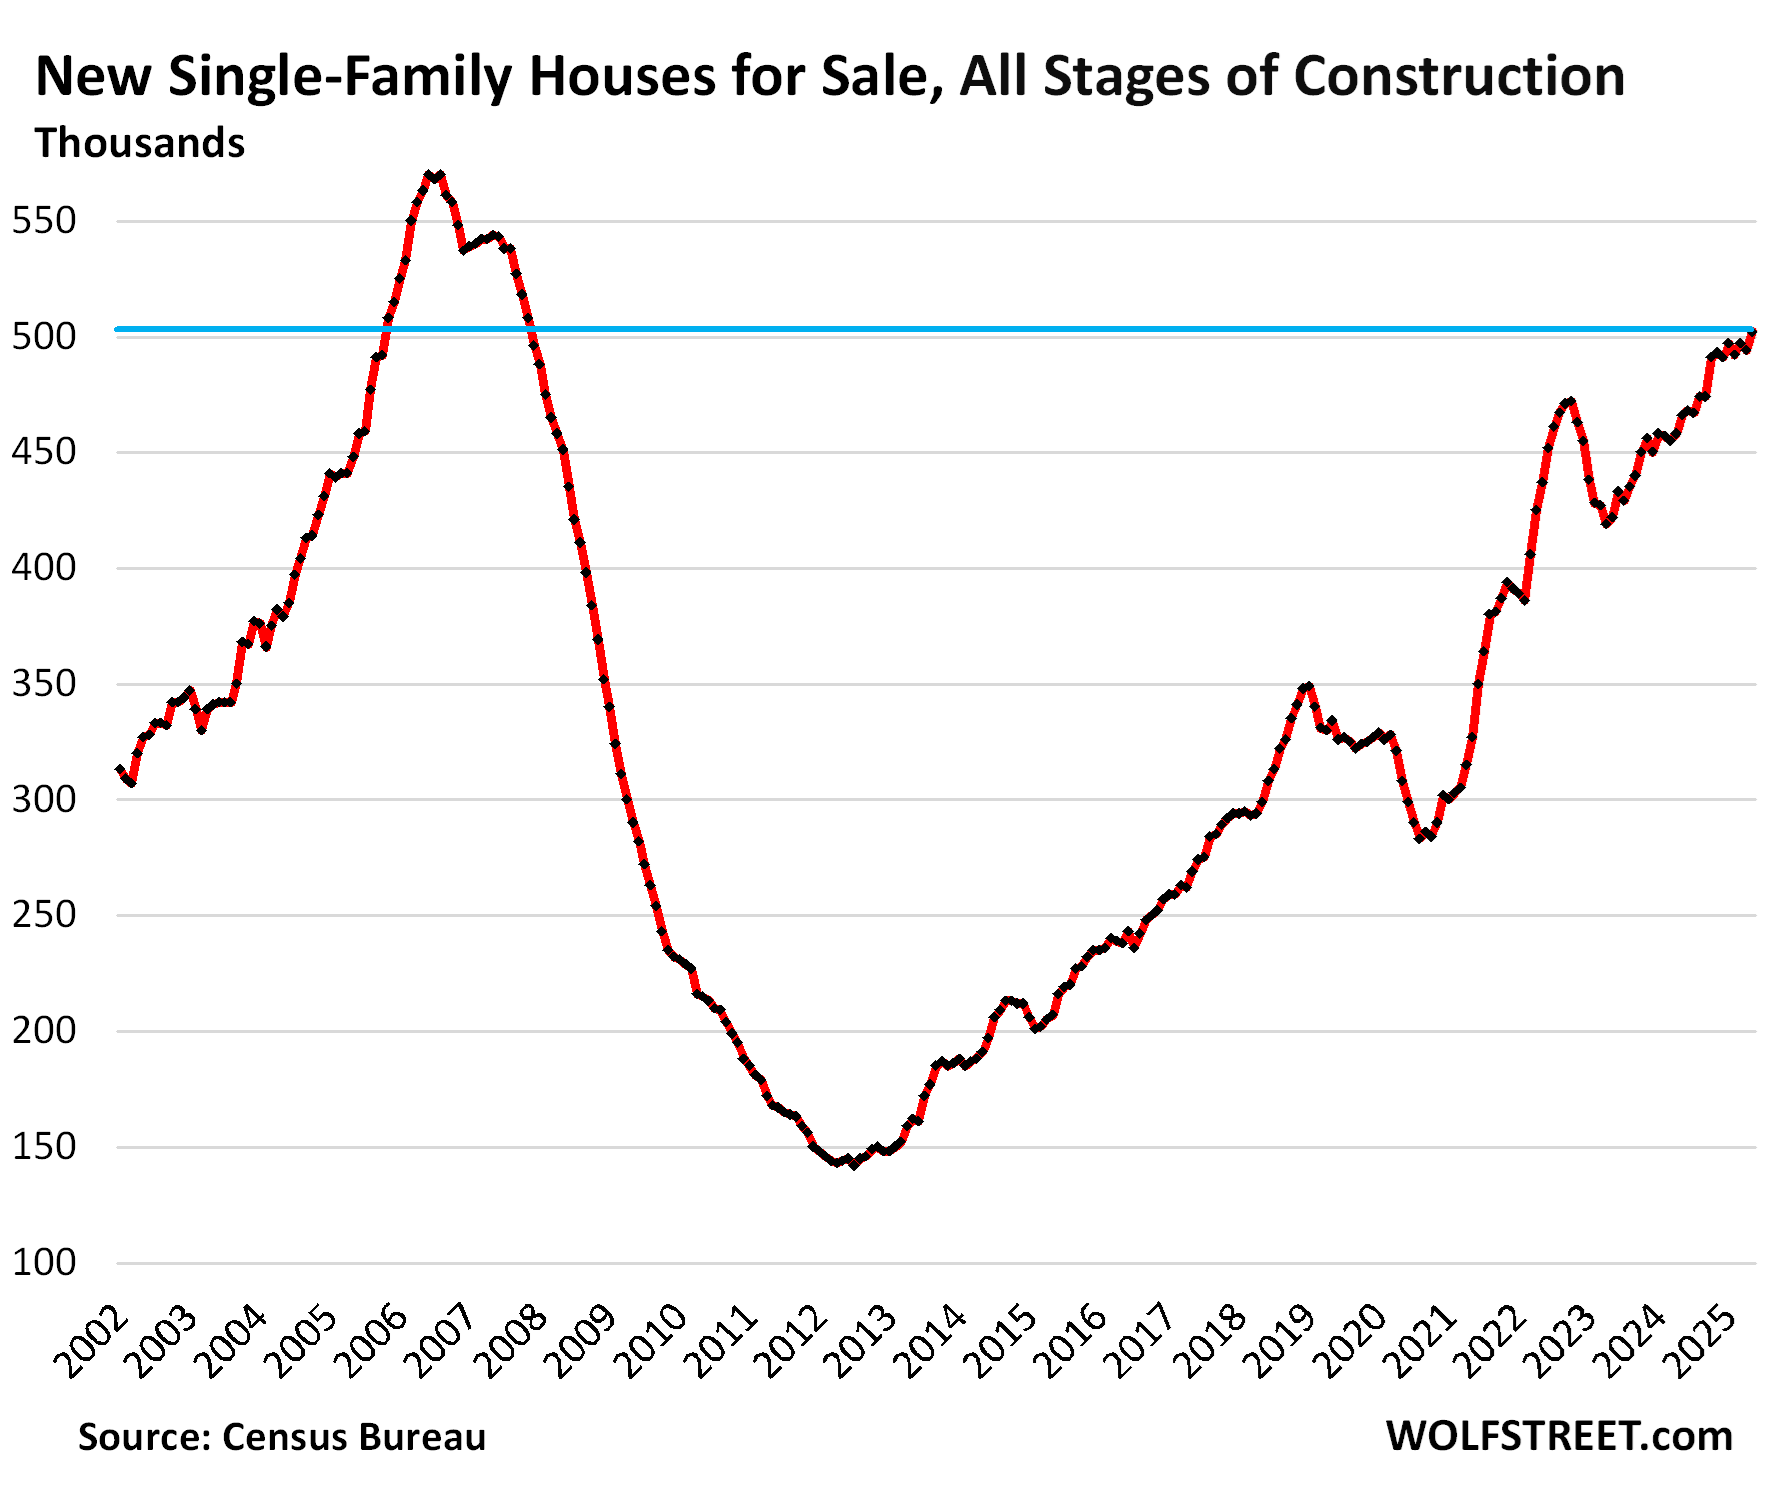
New single-family homes for sale at all stages of construction rose to 502,000 homes in May, the highest since November 2007, when inventory was on the way down during the Housing Bust. Inventory has been above 490,000 for the seventh month in a row, all seven months the highest since November 2007, according to data from the Census Bureau today.
During the housing bust, inventories first reached this level on the way up in October 2005. Over the following three years, oversupply and lack of demand wreaked havoc among the homebuilders.
But now there is still somewhat decent demand for new homes, as homebuilders are cutting prices and offering massive incentives – especially costly mortgage-rate buydowns – to take sales away from homeowners trying to sell at illusory prices, while demand for these existing homes at these prices has collapsed.
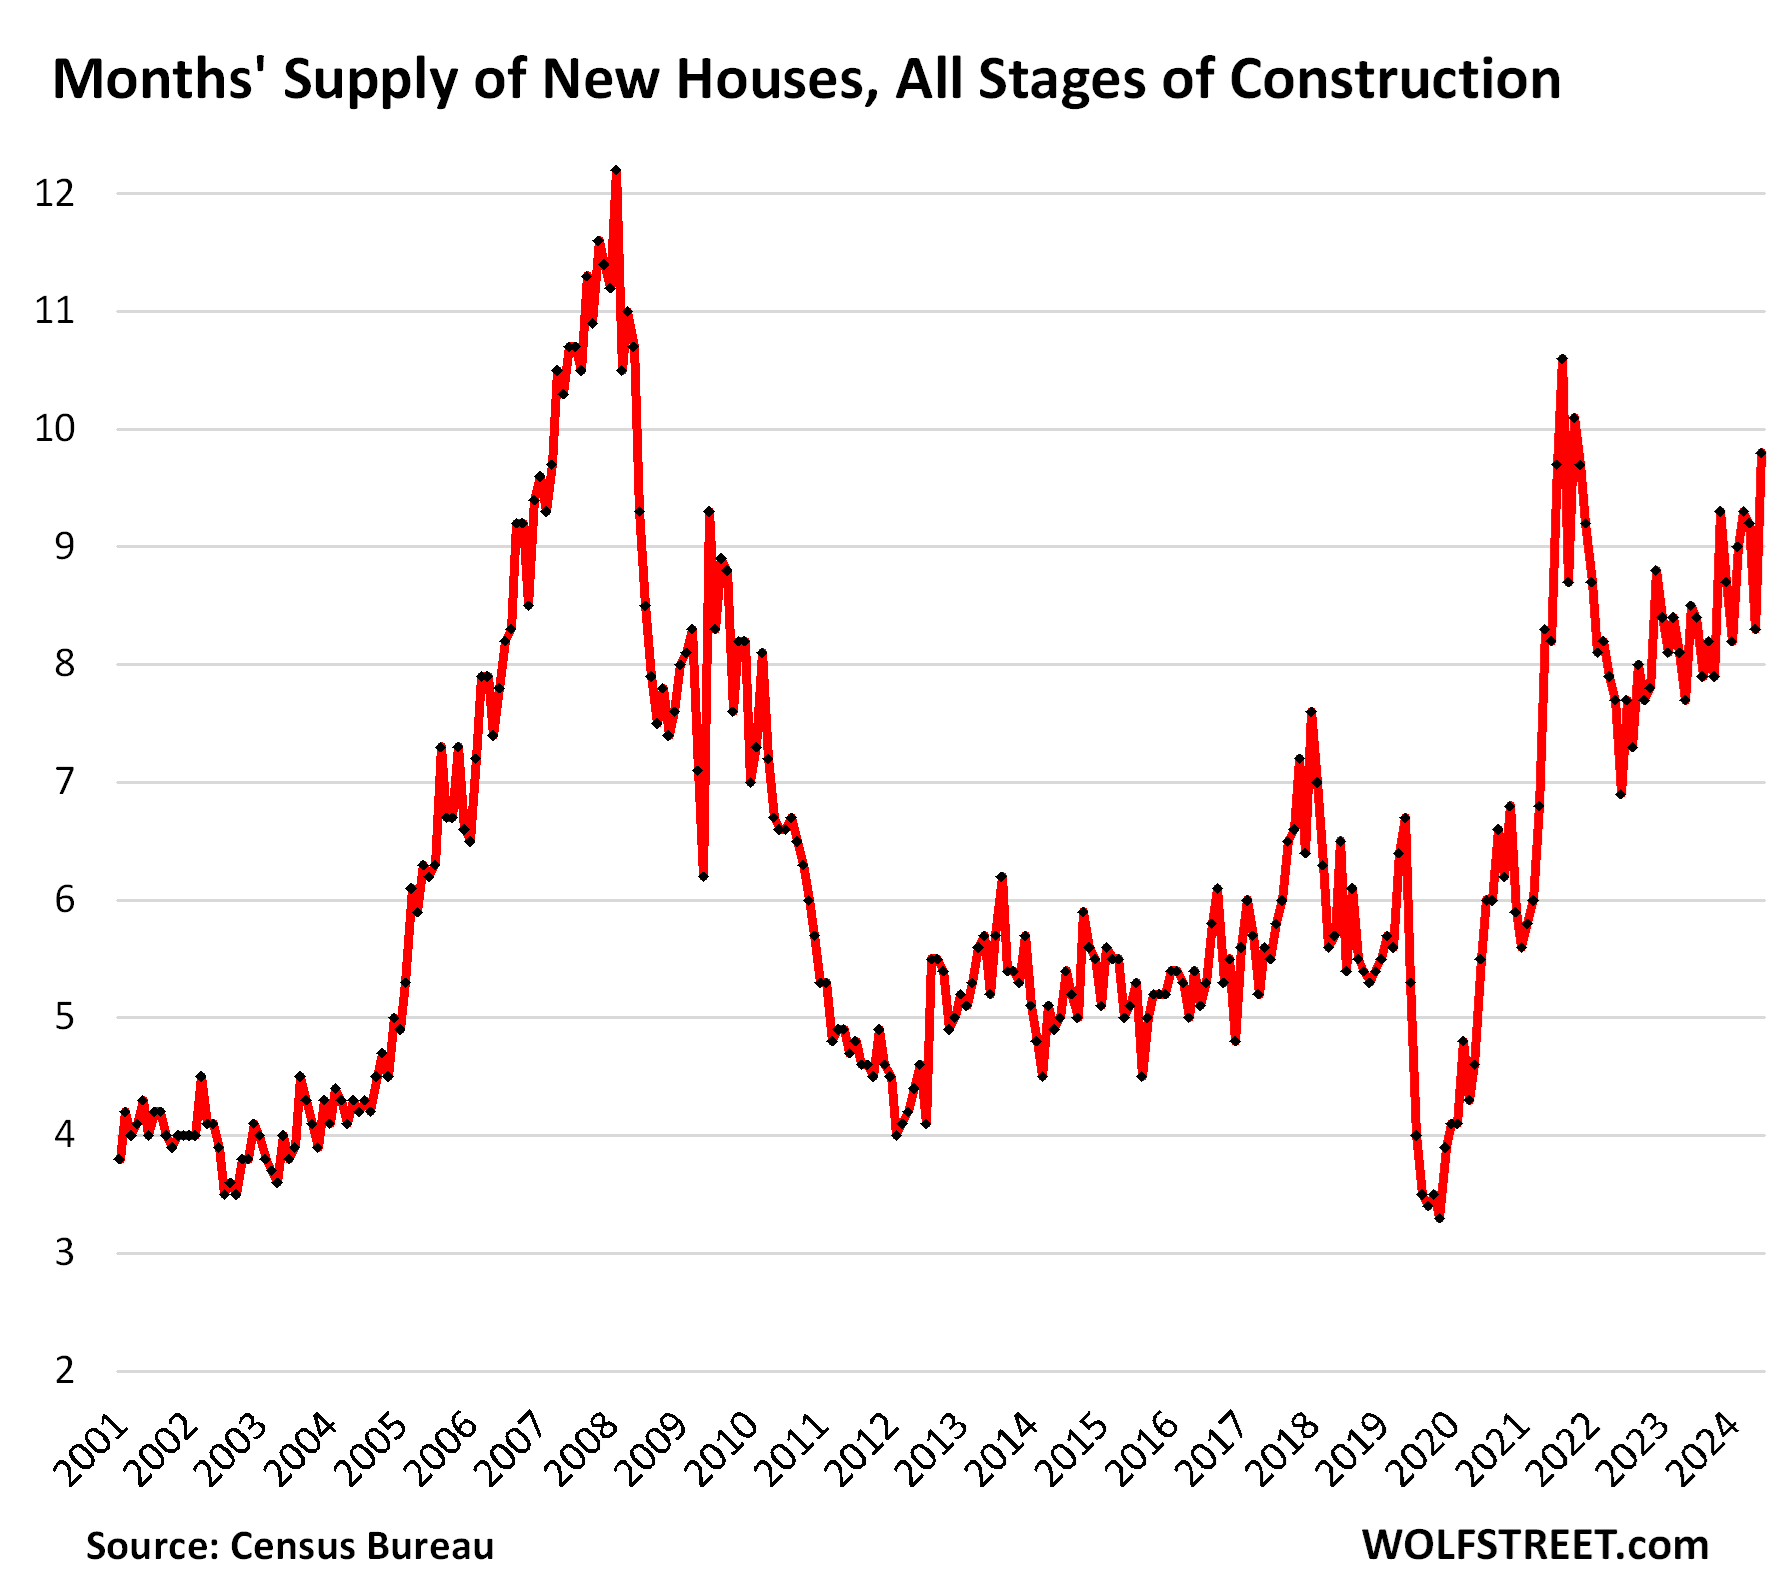
Supply of new homes spiked to 9.8 months in May at the current rate of sales. A glut of new houses on the market is exactly what this overpriced housing market needs.
In their earnings calls, homebuilders are talking about bringing their costs down to be able to sell profitably where demand is, and they’ve been sacrificing gross profit margins for the past two years because they have not been able to get costs down quickly enough. But gross margins had fattened to extraordinary levels during the home-price explosion in 2020 to 2022, and homebuilders have lots of room left to give up – we’ll look at Lennar’s gross margin in a moment.
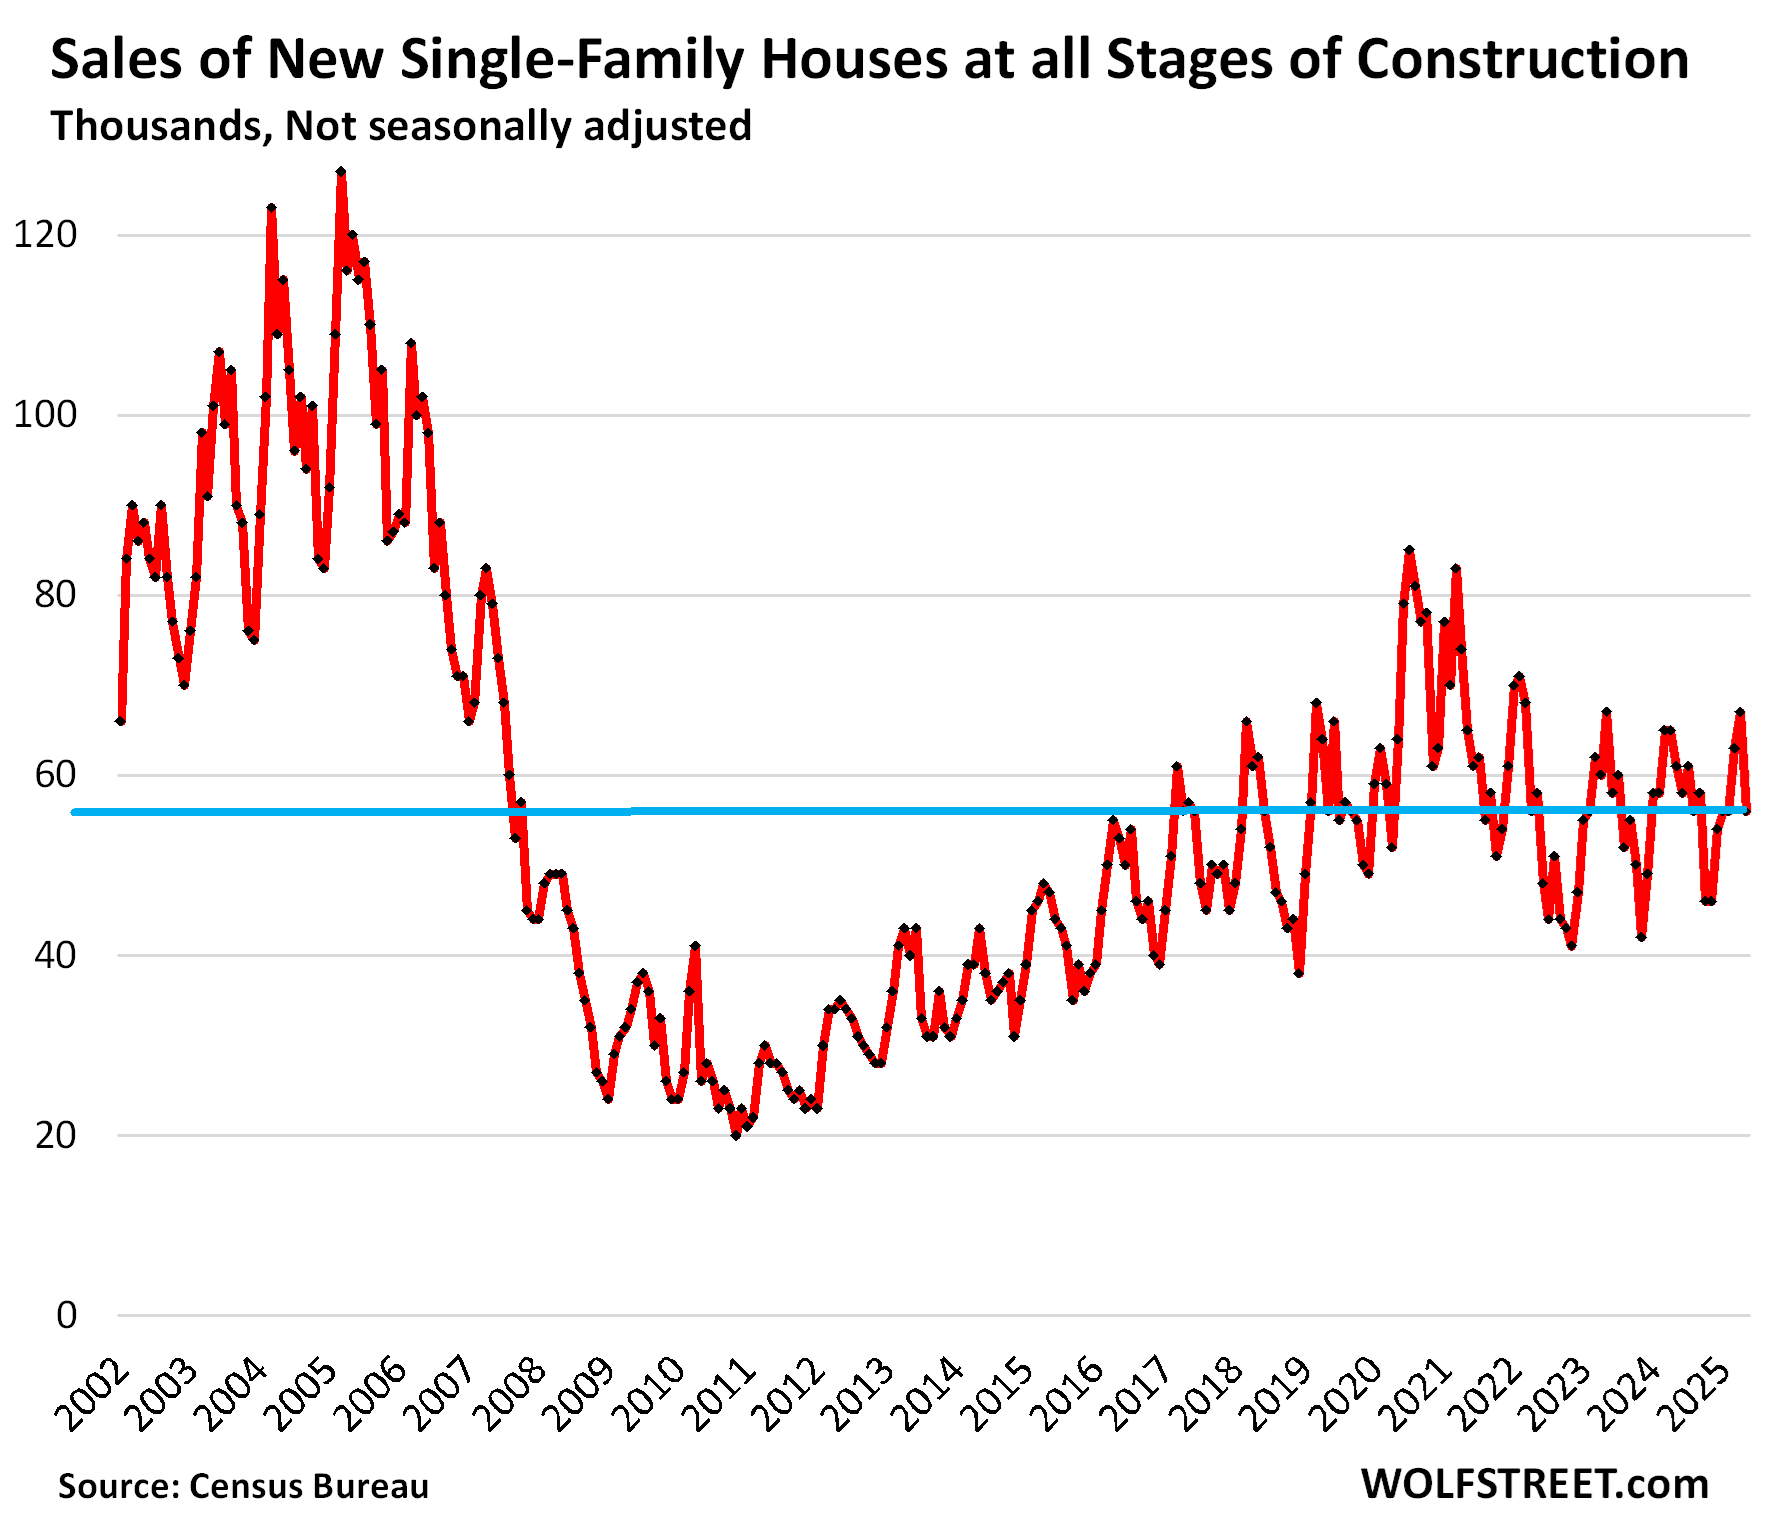
Sales of new homes, at 56,000 contracts signed in May, were down by 8.2% from a year ago and down by 12.5% from May 2019.
These sales are tracked by signed contracts, not closed sales. Some of these deals will fall through before closing. As such, they compare to “pending sales” of existing homes, which are also based on signed contracts, not closed sales. April pending sales were down by 32% from 2019, the pre-pandemic normal, reflecting the ongoing collapse in demand for existing homes.
So compared to existing homes, sales of new homes are in far better shape. Homebuilders face a tough market, but they cannot just not sell and wait for better days – unlike homeowners. It’s their business, and they have to build homes and sell homes, no matter what the market is, and they have to find the price points at which they can do so.
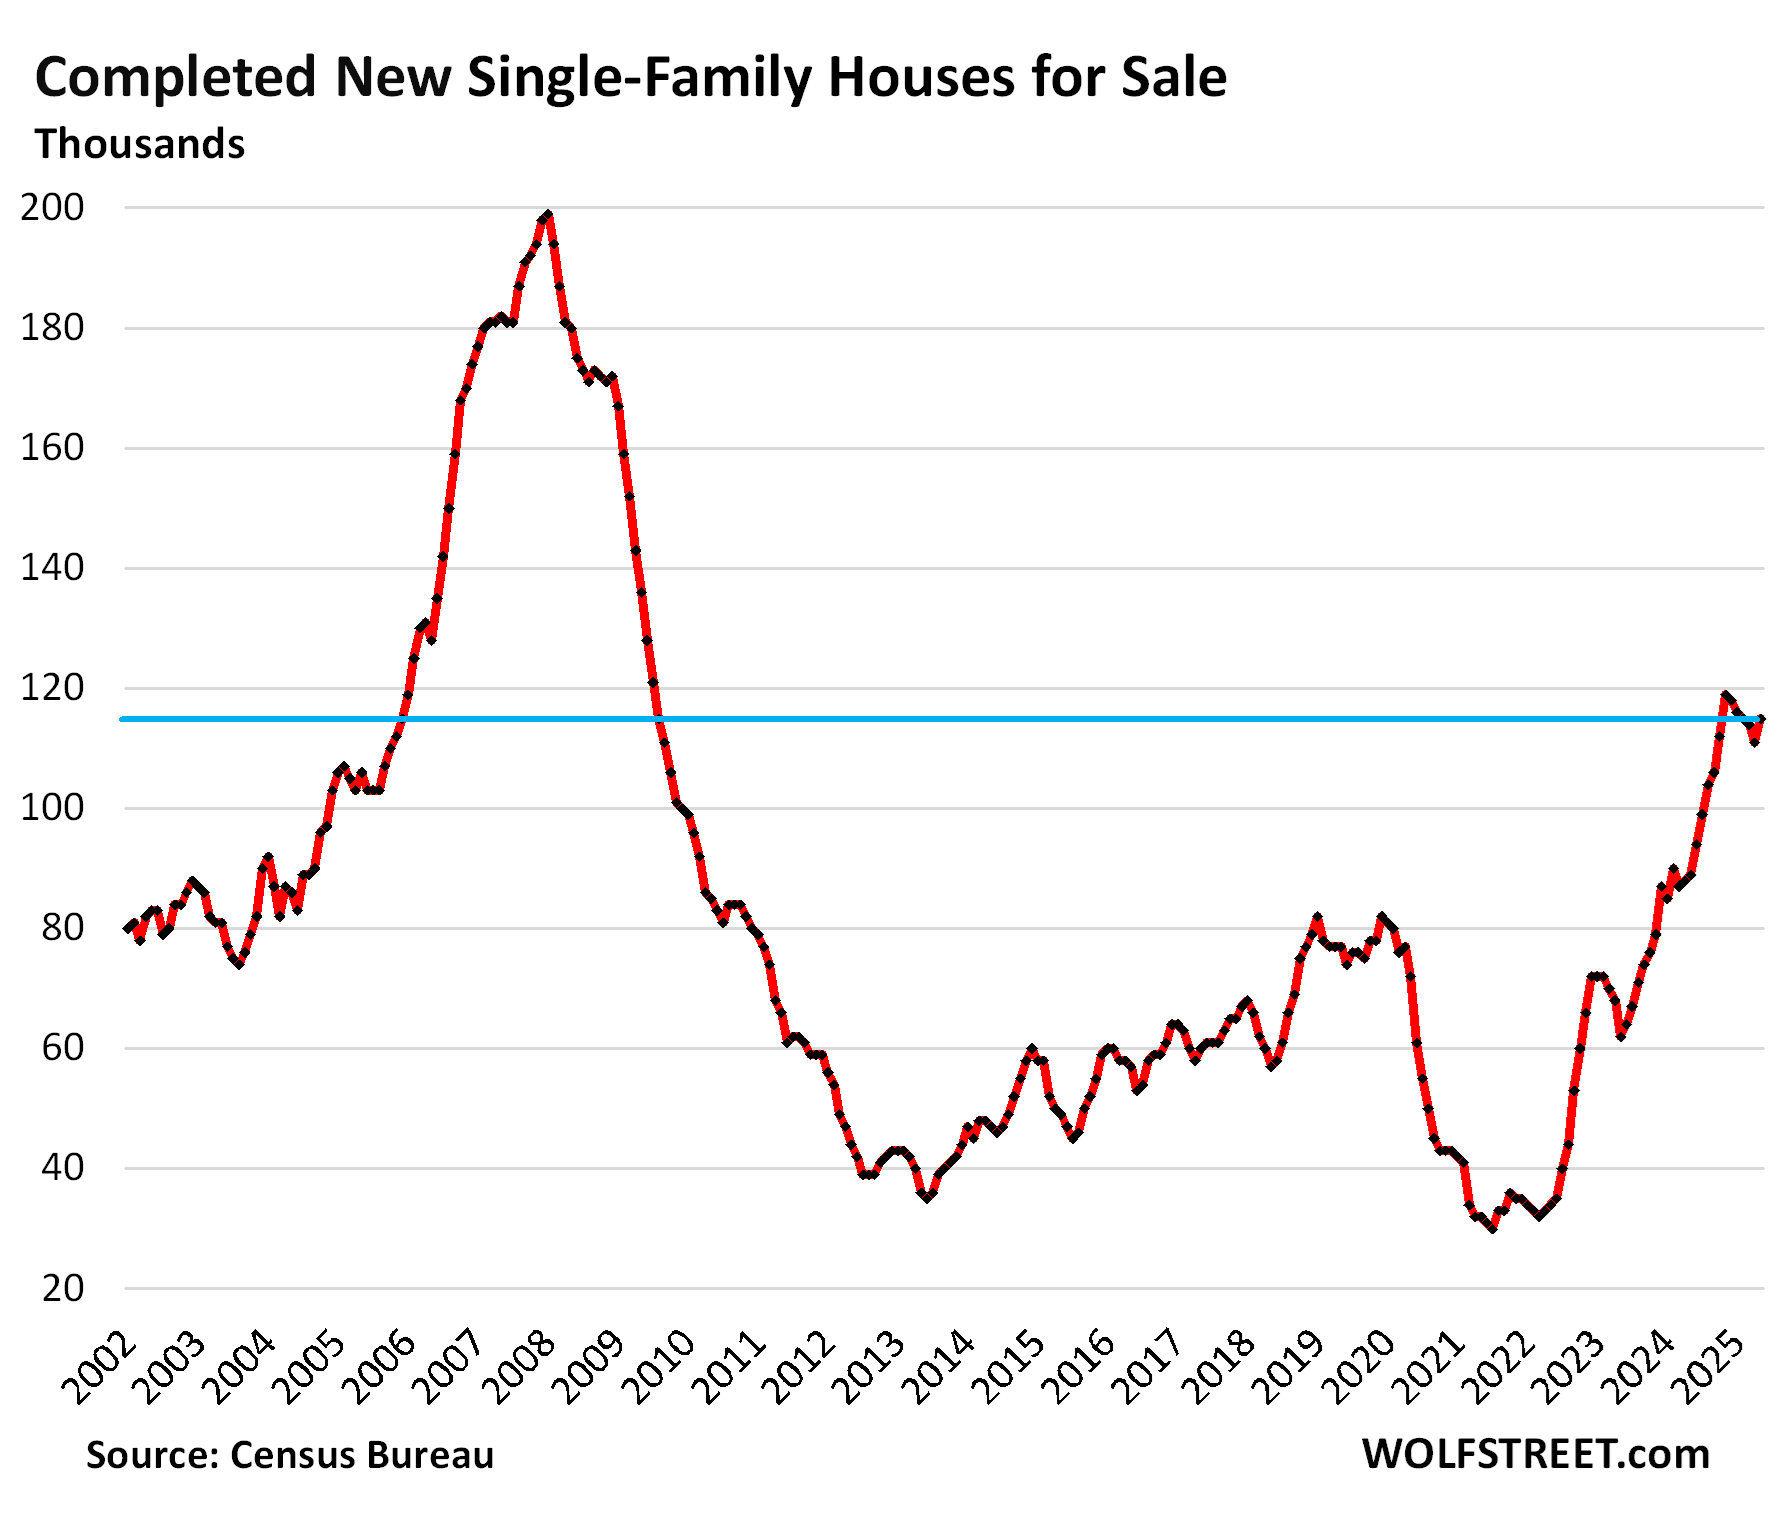
Inventories of completed new single-family houses for sale rose to 115,000 in May, up by 29% year-over-year, and up by 49% from May 2019. Inventories have been at this about level or higher for the seventh month in a row.
Homebuilders are motivated to sell them quickly because they’ve sunk a lot of capital into them.
And they’re selling them at a good clip. Sales of completed homes, at 30,000, were unchanged from a year ago, and up by 36% from May 2019. This is where the action is. Supply was about four months at this rate of sales, roughly normal for normal times, but double of where it had been in 2021 and 2022.
The publicly traded homebuilders have been shedding some light on their strategies in this market as their shares have sunk from their highs in mid-October: DR Horton [DHI] -34%, Lennar [LEN] -39%, KB Home [KBH] -37%, PulteGroup [PHM] -30%, etc.
Lennar has been disclosing more details about its incentive spending than some of the other homebuilders, and it has done so for years in the same format, so we’ll use it here as an example.
Incentive spending jumped to 13.3% of revenues, “primarily” due to mortgage-rate buydowns, said Lennar Co-CEO Stuart Miller in the earnings call earlier in June for Lennar’s Q2 ended May 31.
This 13.3% was the highest incentive spending rate since 2009, and up from 8.4% in Q2 2023 and up from 1.5% in Q2 2022.
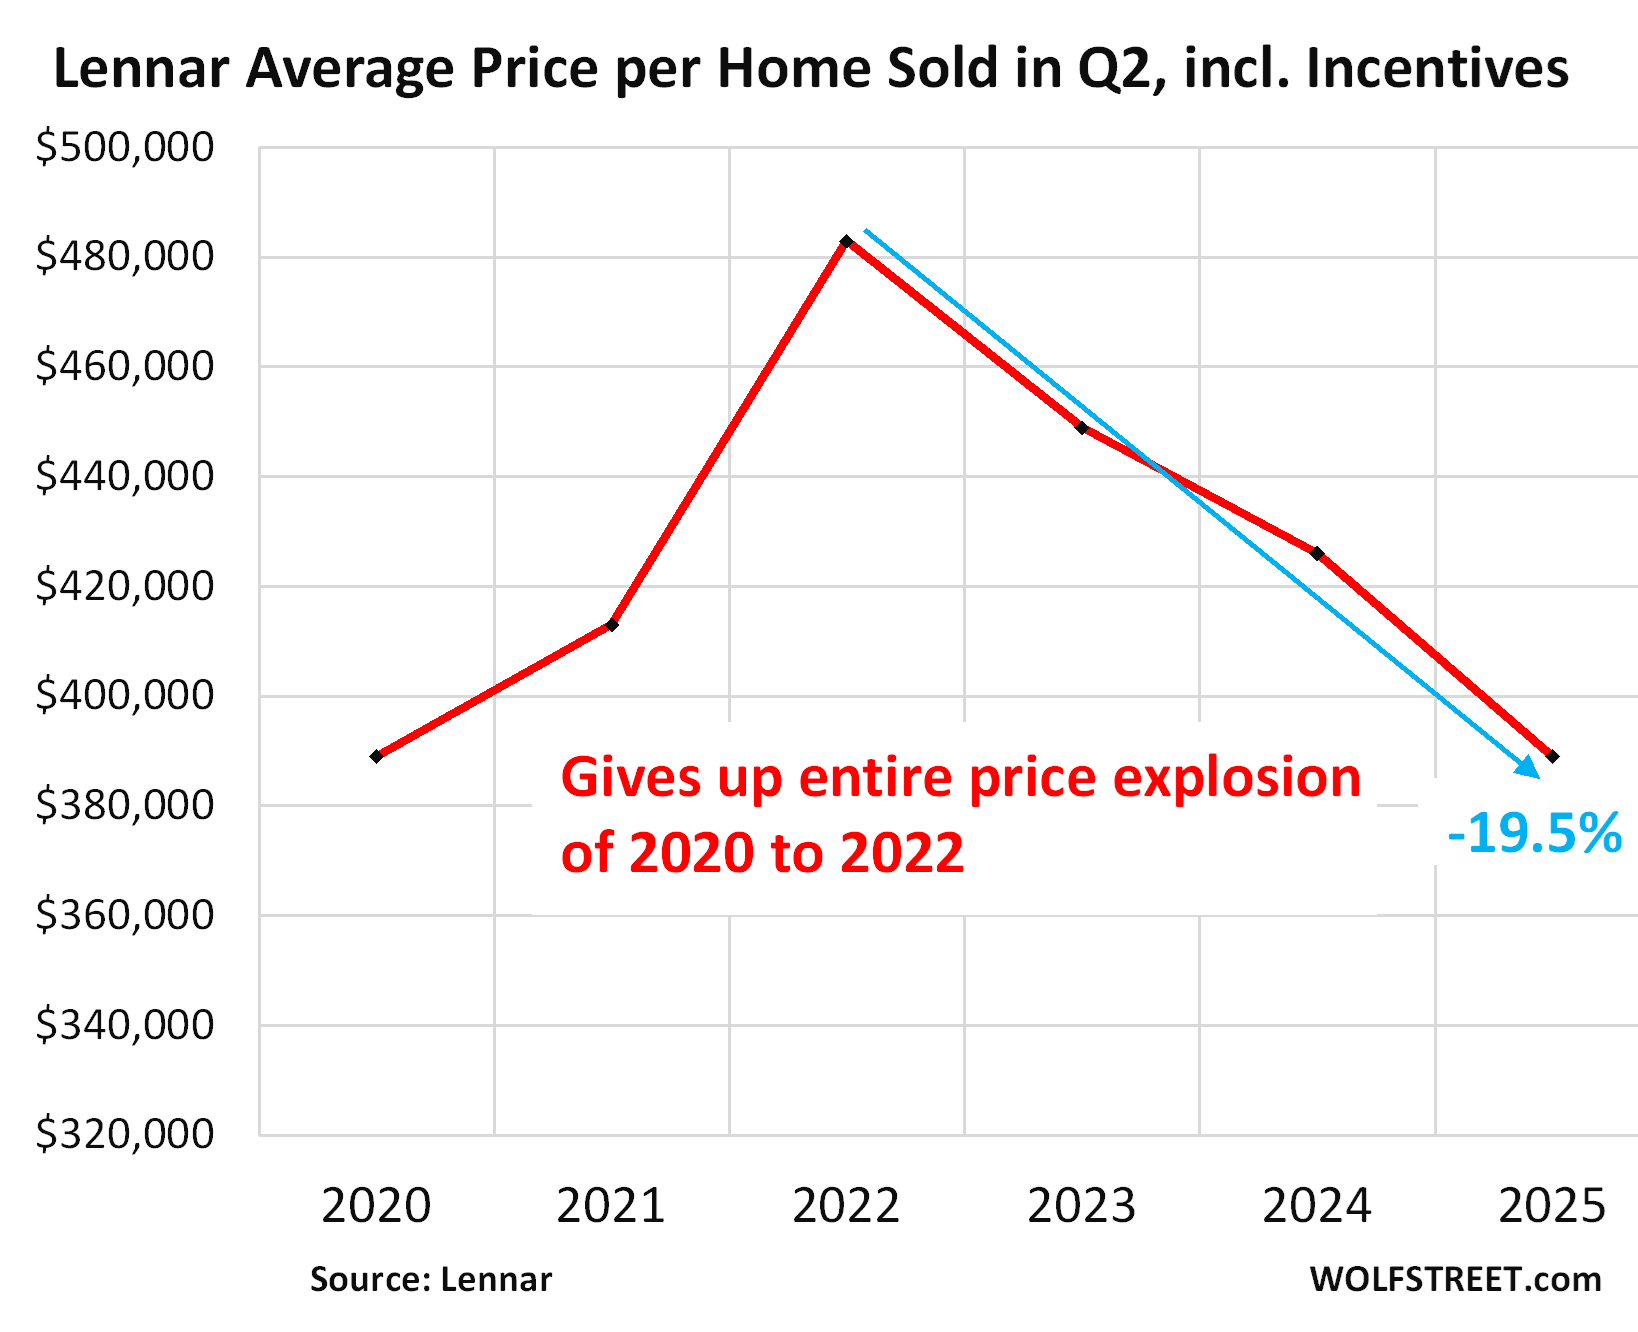
The average sales price per delivered home, which includes all incentives, dropped by 8.7% year-over-year, to $389,000 in Q2. Compared to Q2 2022 ($483,000), it dropped by 19.5%. It’s back where it had been in Q2 2020, having given up the entire price explosion of 2020 to 2022.
Homeowners wanting to sell have no idea what they’re up against:
Gross profit margin on home sales dropped to 17.8%, down from the fat profit margin in Q2 2023 of 22.5% and from the obese profit margins in Q2 2024 of 29.5% when FOMO-addled homebuyers lined up to pay whatever, and homebuilders were happy to let them pay whatever.
So price reductions have largely come out of the obese profit margins. But Lennar talked a lot about bringing its costs down over time to hit the “affordability” targets while still remaining profitable.
In the earnings call, Co-CEO Stuart Miller said among other things (transcript via Seeking Alpha):
“As mortgage interest rates moved higher for longer and consumer confidence declined, we continue to drive volume with our starts, while we incentivize sales to enable affordability.
“As a result, during the second quarter, sales incentives rose again to 13.3% reducing our gross margin to 18%, excluding purchase accounting, as expected, on a lower-than-expected average sales price.
“We expect our average sales price [in Q3] to be between $380,000 and $385,000 as we expect to continue to see pricing pressure on homes that will be sold during the quarter.”
“The markets that experienced more challenging conditions during the quarter were:
- the Pacific Northwest markets of Seattle and Portland
- the Northern California markets of the Bay area in Sacramento
- the Southwestern market of Phoenix, Las Vegas and Colorado
- and some Eastern markets such as Raleigh, Atlanta and Jacksonville.
“These markets experienced sensitivity to higher home prices and/or the macro impact on the technology workforce.
“We expected that the new normal of higher interest rates for longer would mean lower margins for longer as we drove affordability.
“We knew that we and the industry, we’re initially going to have to bring down the price of homes we build through incentives and mortgage buydowns to meet affordability and normalize the supply and demand balance.
“We are building what will become a stronger margin driving platform by using volume to enable us to drive costs down across our platform. We know this takes time, but we also know it will help build a healthier housing market and position Lennar for bottom-line growth even as the market remains soft.
“This trend has started with reducing margins and using incentives to enable affordability. But looking ahead, it is much more about transitioning to lower cost structures.”
But incentives are not included in the median price by the Census Bureau.
The Census Bureau tracks sales prices of new houses by the prices in purchase contracts that buyers signed. These prices that are in the contracts do not include the costs of mortgage-rate buydowns and some other incentives, and thereby overstate the effective sales prices. But homebuilders disclose the effective sales prices net of all incentives – what Lennar calls the “average sales price” – in their financial statements.
So Lennar’s average sales price fell by 19.5% in Q2 2025 from three years ago in Q2 2022, giving up the entire pandemic price spike.
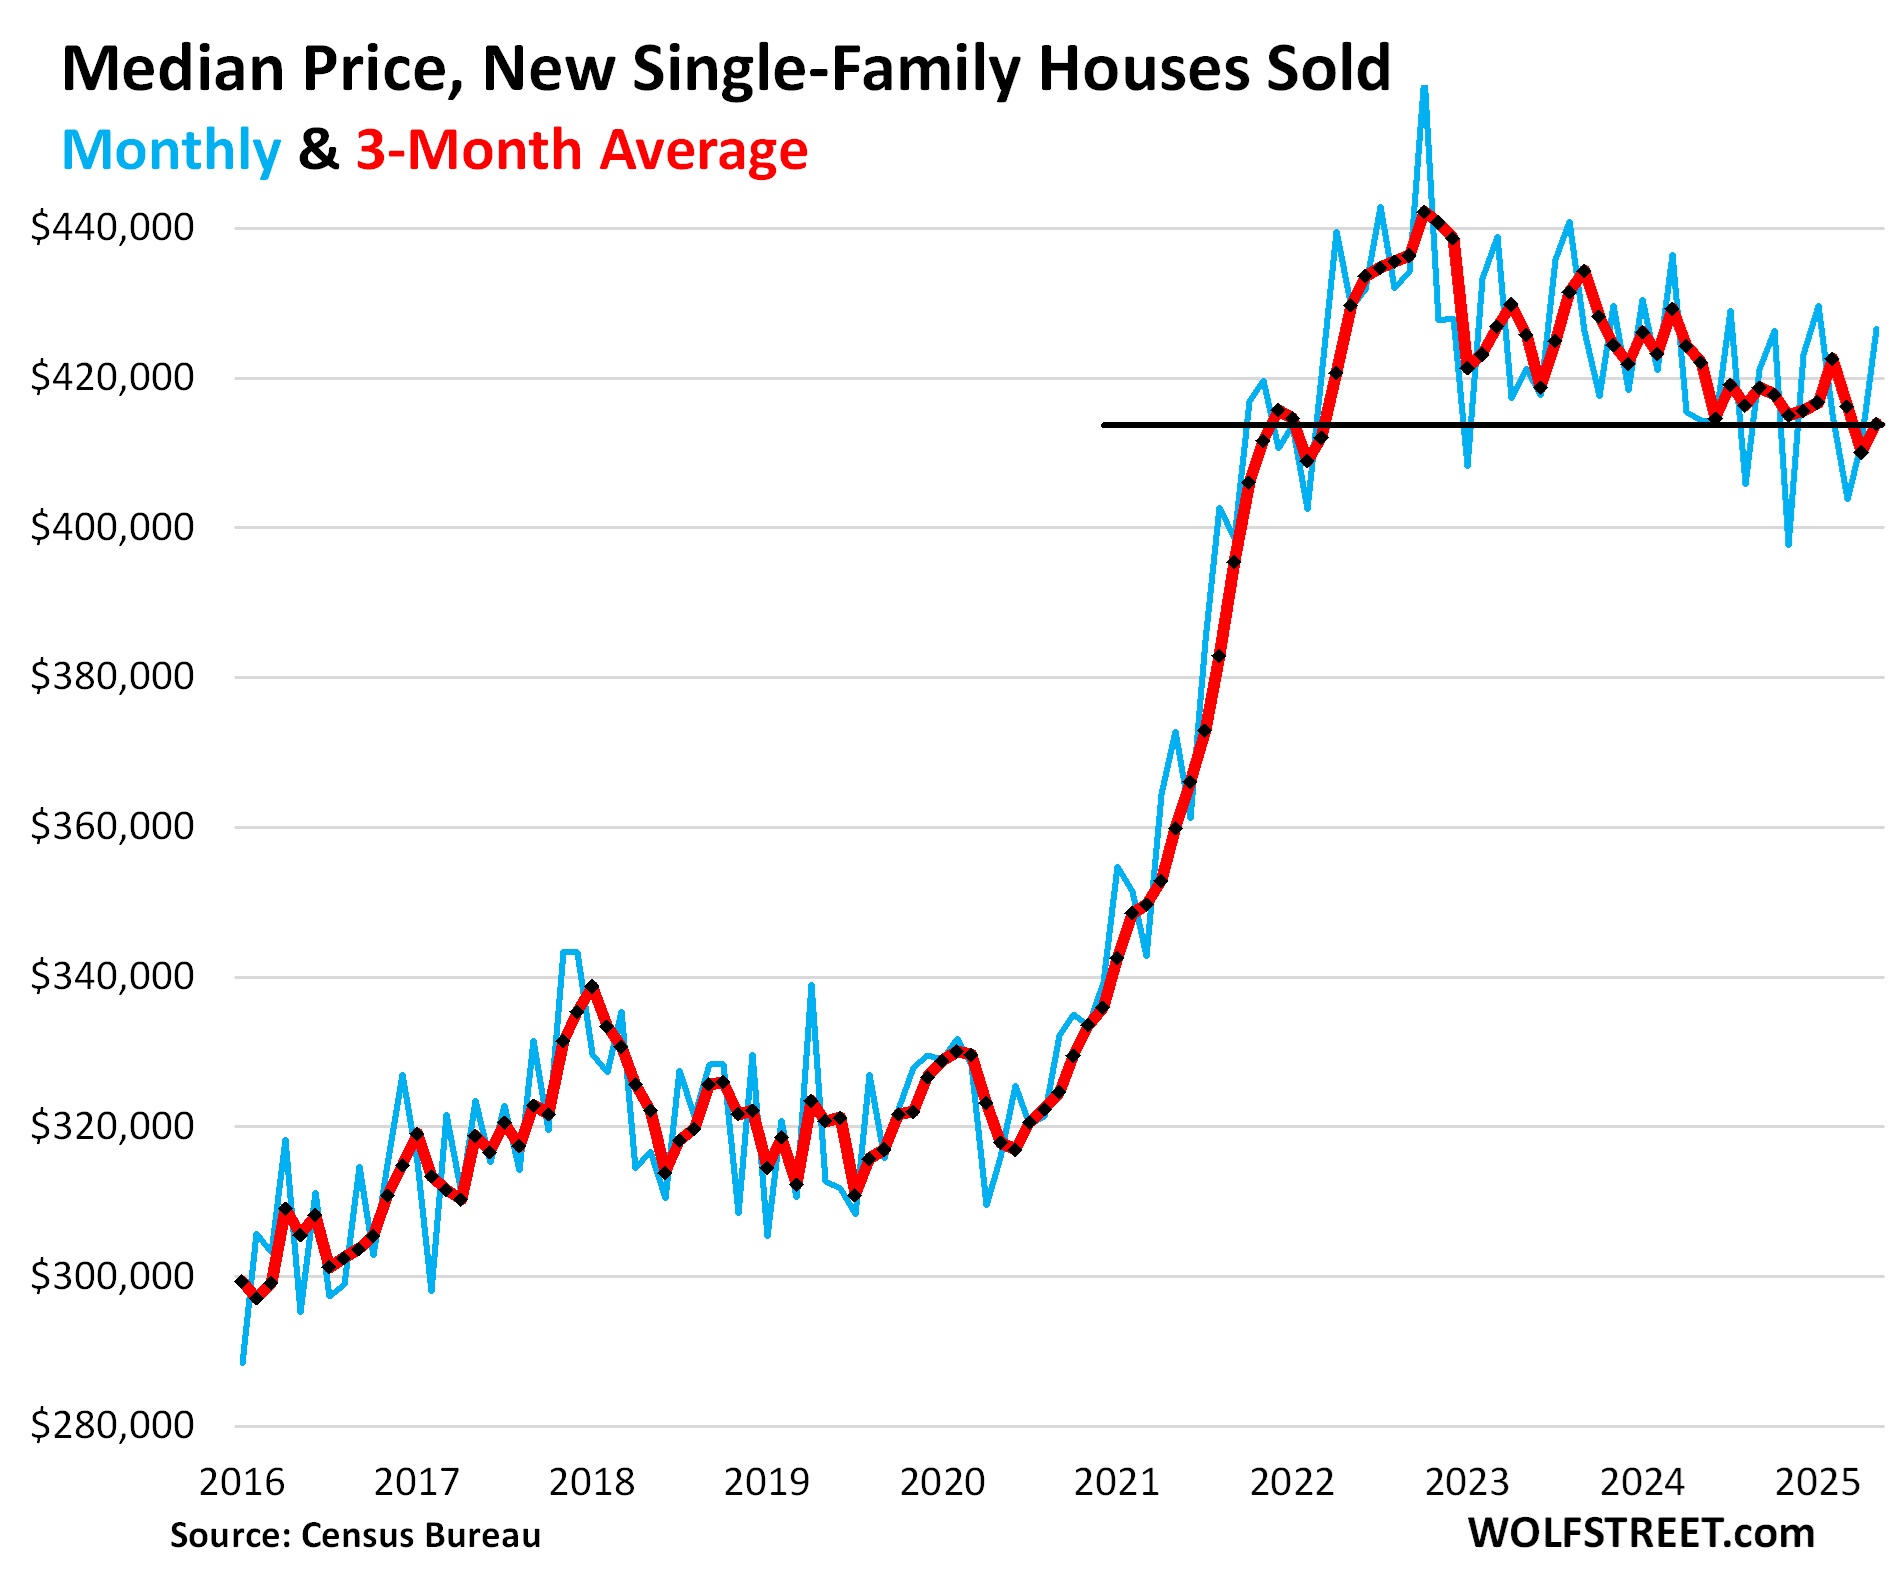
The median contract price, as reported by the Census Bureau, has also zigzagged lower, but only barely, because the rising costs of the mortgage-rate buydowns and other incentives – that have soared to 13.3% of revenues at Lennar – are not included.
In May, the median contract price rose to $426,600 (blue in the chart below). The three-month average, which irons out some of the month-to-month squiggles rose to $413,900 (red). This was down by only 1.9% year-over-year and by 6.4% from the peak in 2022.
Inventory for sale by region.
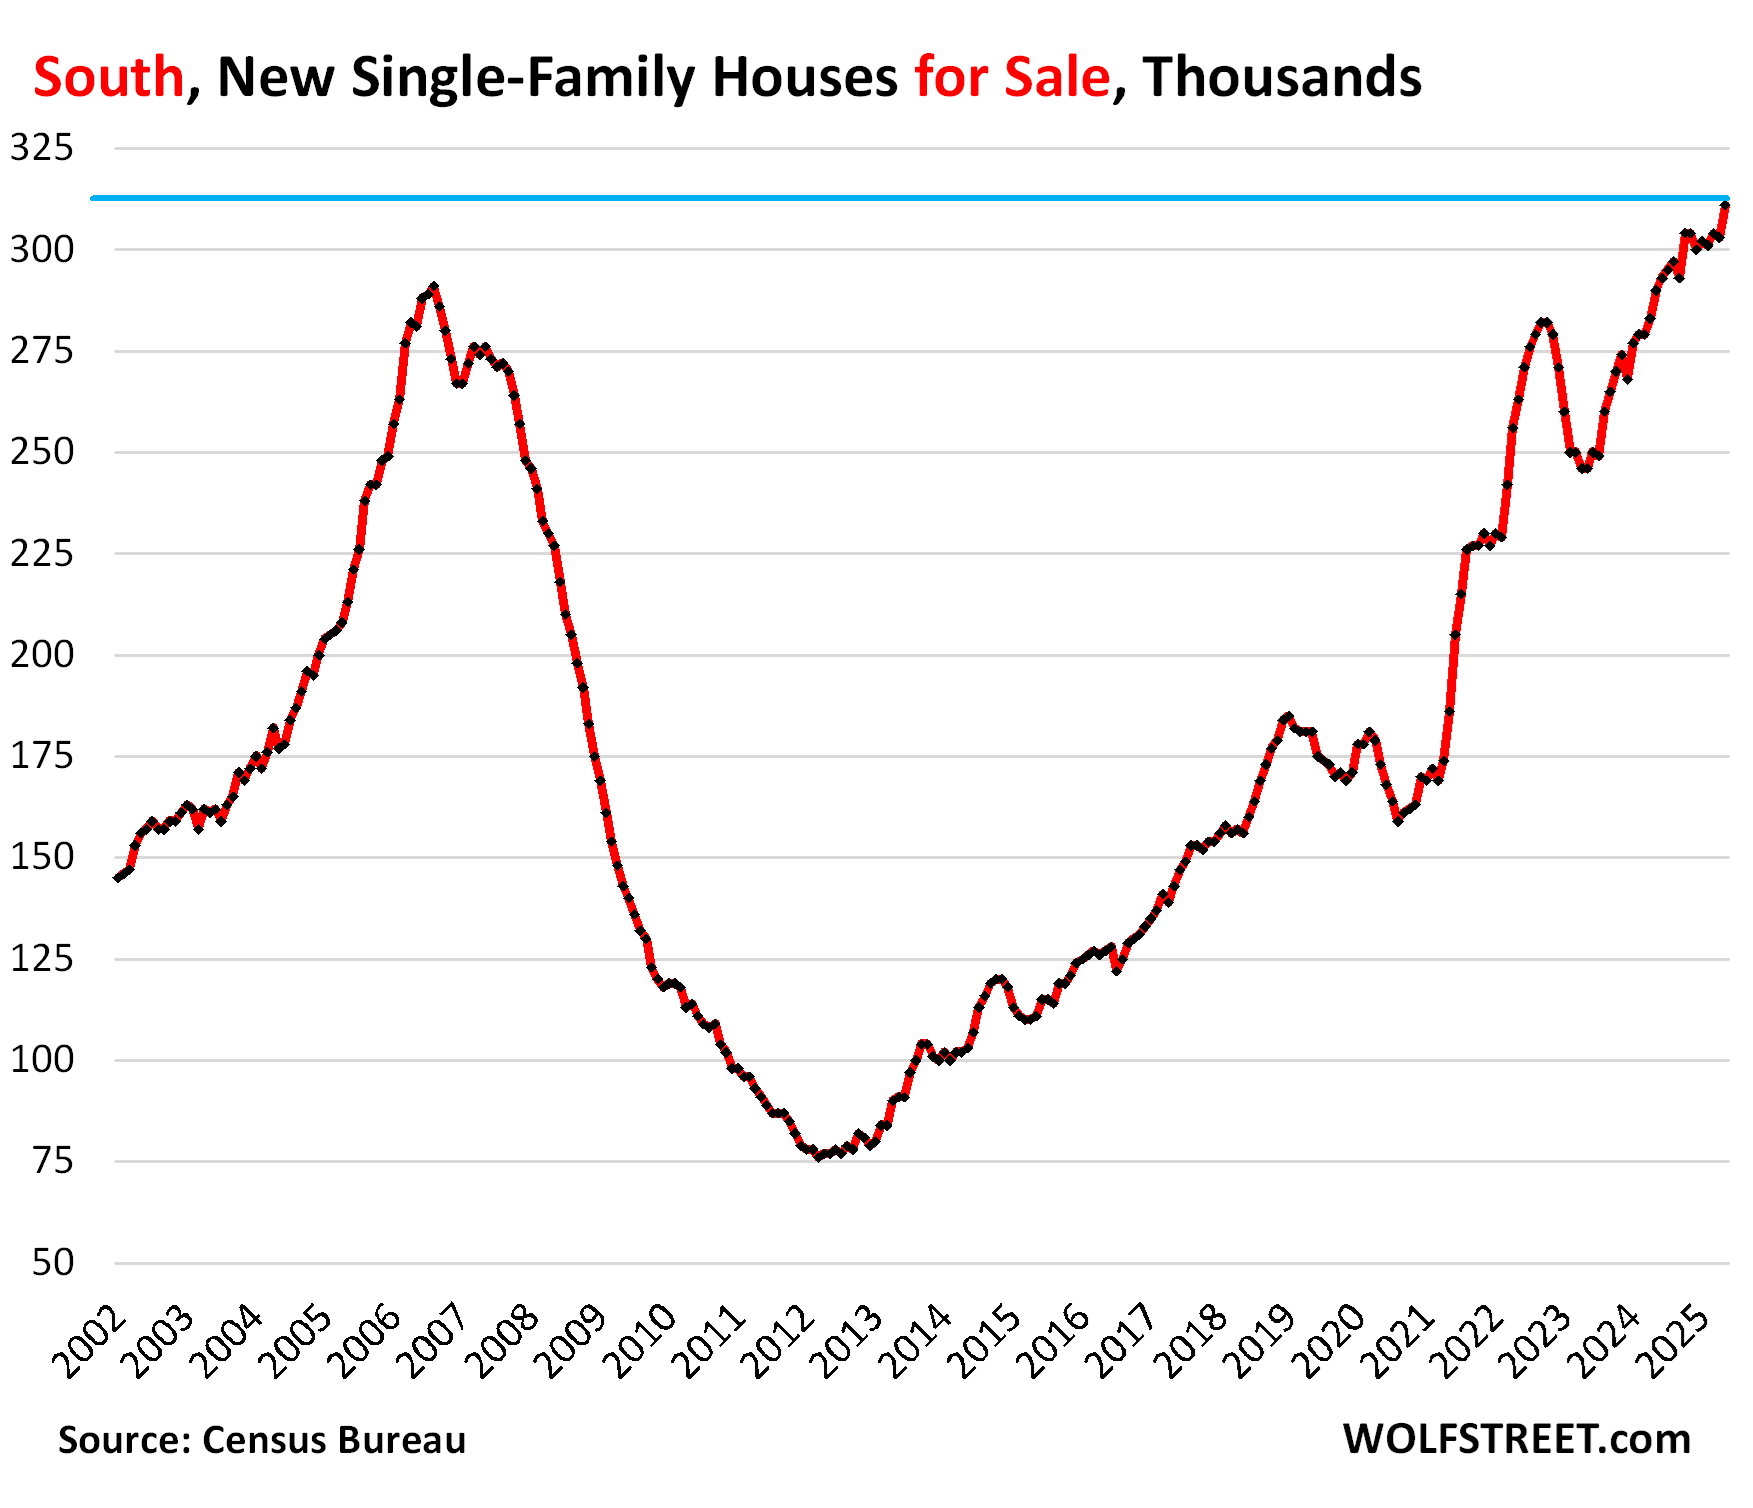
In the South, inventories of new houses for sale at all stages of construction jumped to a record of 311,000 in May, well above the peak levels during the Housing Bust, and up by 71% from May 2019! Inventory for sale has been above the Housing Bust peak for an entire year.
The huge Census region, dominated by Texas and Florida, typically with the most vibrant population growth, is by far the largest market for new houses in the US, accounting for 62% of total US inventory for sale, and for 55% of total US sales in May (a map of the four Census regions is below the article at the top of the comments).
Sales plunged by 16% year-over-year in May to just 31,000 new homes. Compared to May 2019, sales were down by 11%. Given the surge in inventory, and the drop in sales, supply jumped to 10 months.
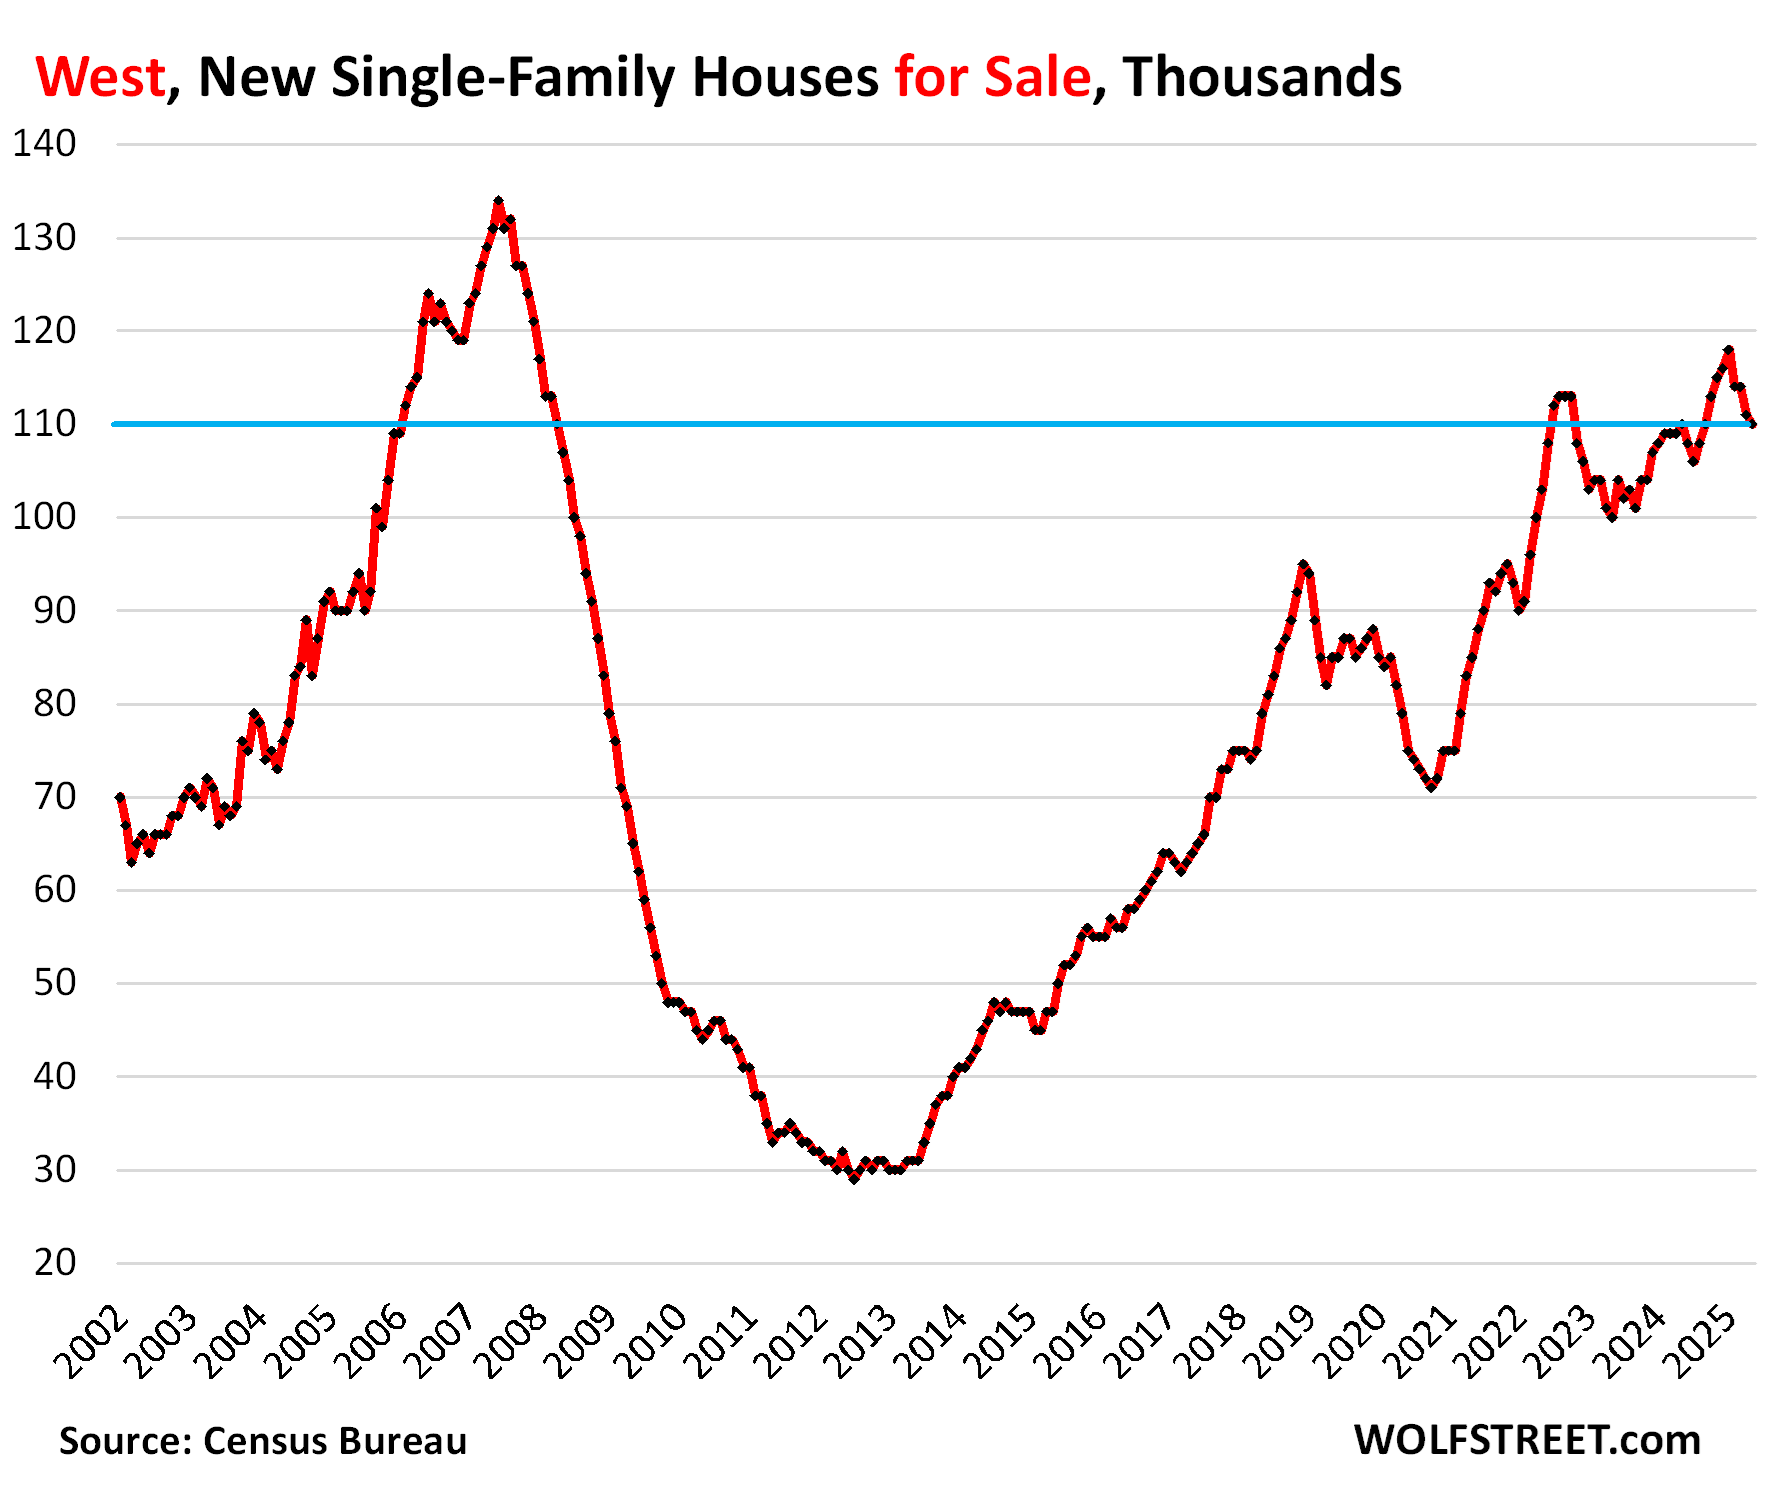
In the West, inventories dipped to 110,000, unchanged year-over-year, and up by 29% from May 2019.
The West accounted for 22% of the total US inventory and for 27% of total US sales in May.
Sales in the West remained at 15,000 new homes, up by 7% year-over-year and up by 25% from May 2019.
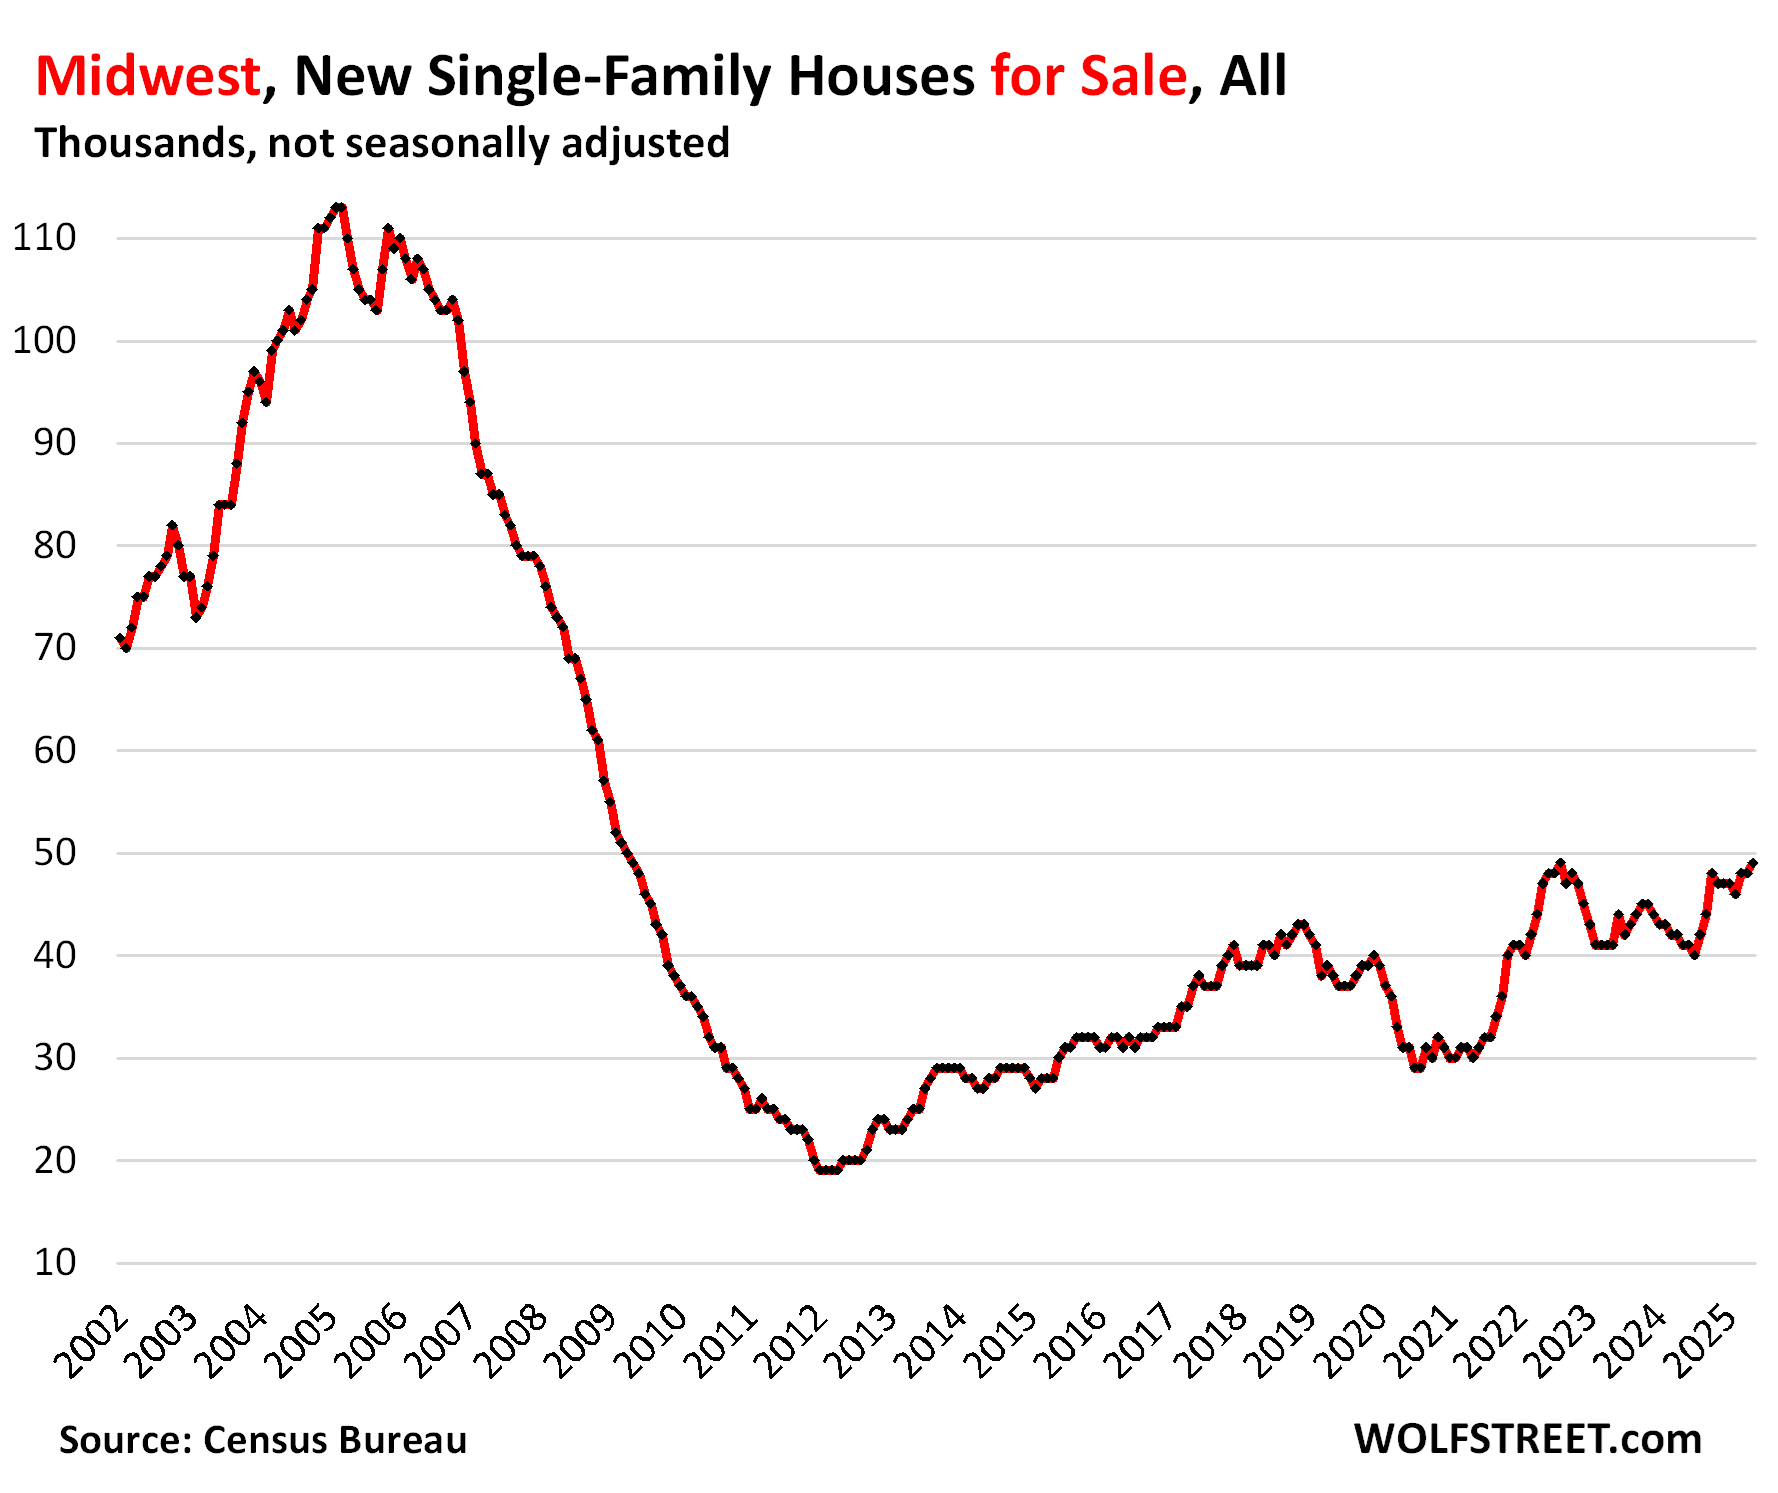
In the Midwest, inventory rose to 49,000, up by 19% year-over-year and up by 29% from May 2019.
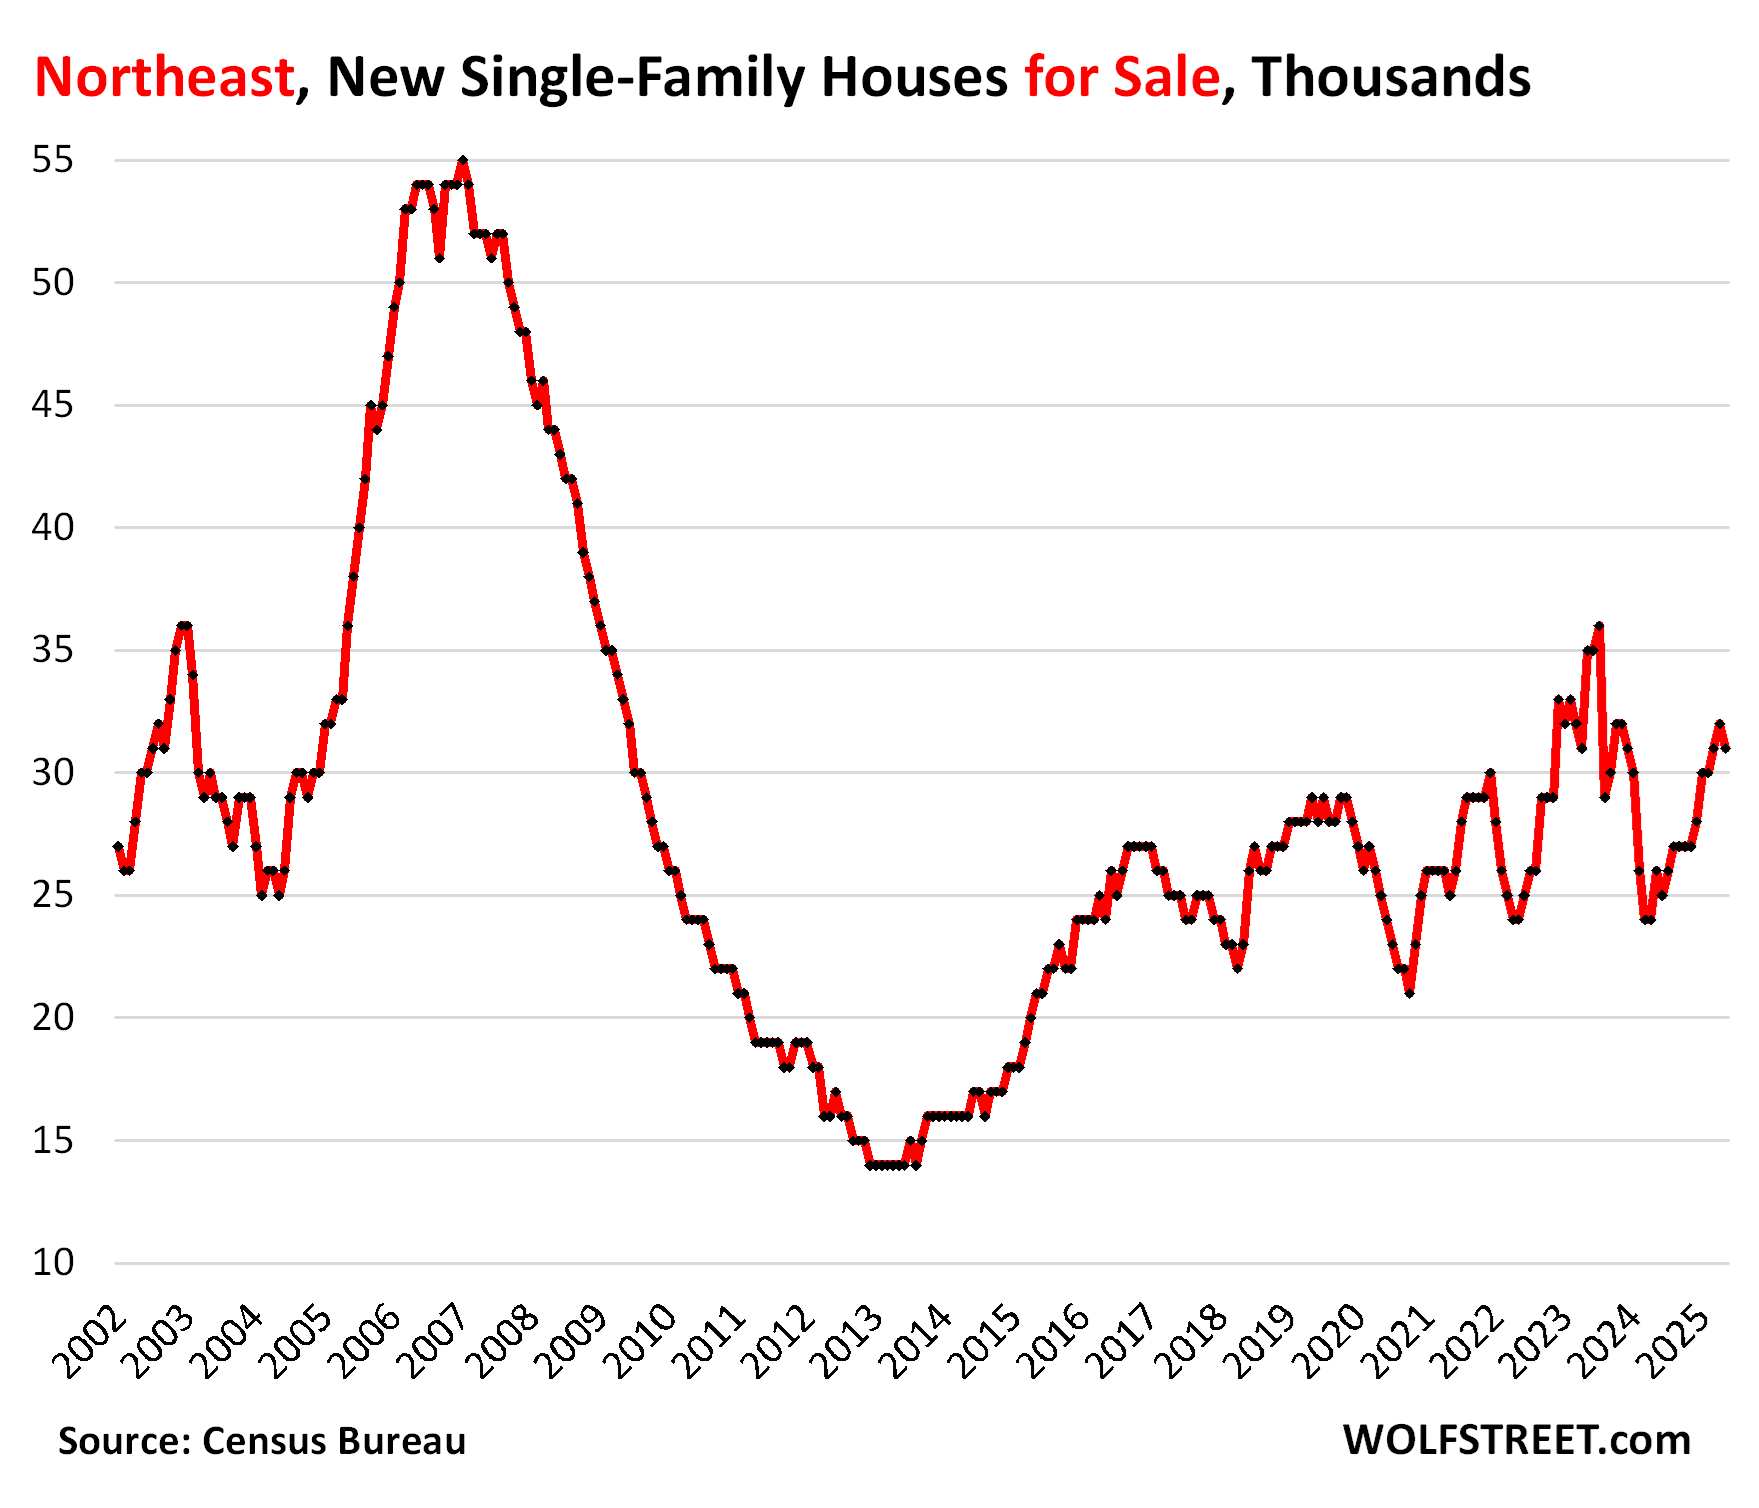
In the Northeast, inventory dipped to 31,000, up by 19% year-over-year and by 7% from May 2019.
Enjoy reading WOLF STREET and want to support it? You can donate. I appreciate it immensely. Click on the mug to find out how:

![]()
The post Inventory of New Single-Family Homes for Sale Highest since 2007, amid Record Pile-up in the South, as Sales Drop: Homebuilders Face a Tough Market appeared first on Energy News Beat.
“}]]