
[[{“value”:”
Active listings in San Diego +70% yoy, Los Angeles +50%, San Jose & Silicon Valley +67%; San Francisco metro +43% (highest April since at least 2016)
By Wolf Richter for WOLF STREET.
It’s not that new listings are that high; they’re not. It’s that the homes that have been listed for sale aren’t selling, and the new listings pile on top of it, and overall inventory is suddenly ballooning at an astonishing rate. The same dynamic is taking place in other markets, and we discussed the the situation in Florida the other day. Now we’ll look at four major markets in California – Los Angeles County, San Diego County, the San Francisco metro, and San Jose metro (which include Silicon Valley) – and California overall.
San Francisco-Oakland-Fremont metro: Year-over-year, active listings jumped by 43% in April, after three massive month-to-month spikes in a row of +21% in April, +27% in March, and +21% in February. The 4,354 homes for sale were the most in the data from realtor.com going back to 2016, and by far the most for any April in the data. Compared to April 2019 (purple dotted line), active listings were up by 27%. That was quick, how fast that endlessly hyped “housing shortage” has evaporated.
This metropolitan statistical area (MSA) includes the counties of San Francisco and San Mateo (which includes the northern portion of Silicon Valley), part of the East Bay, and part of the North Bay.
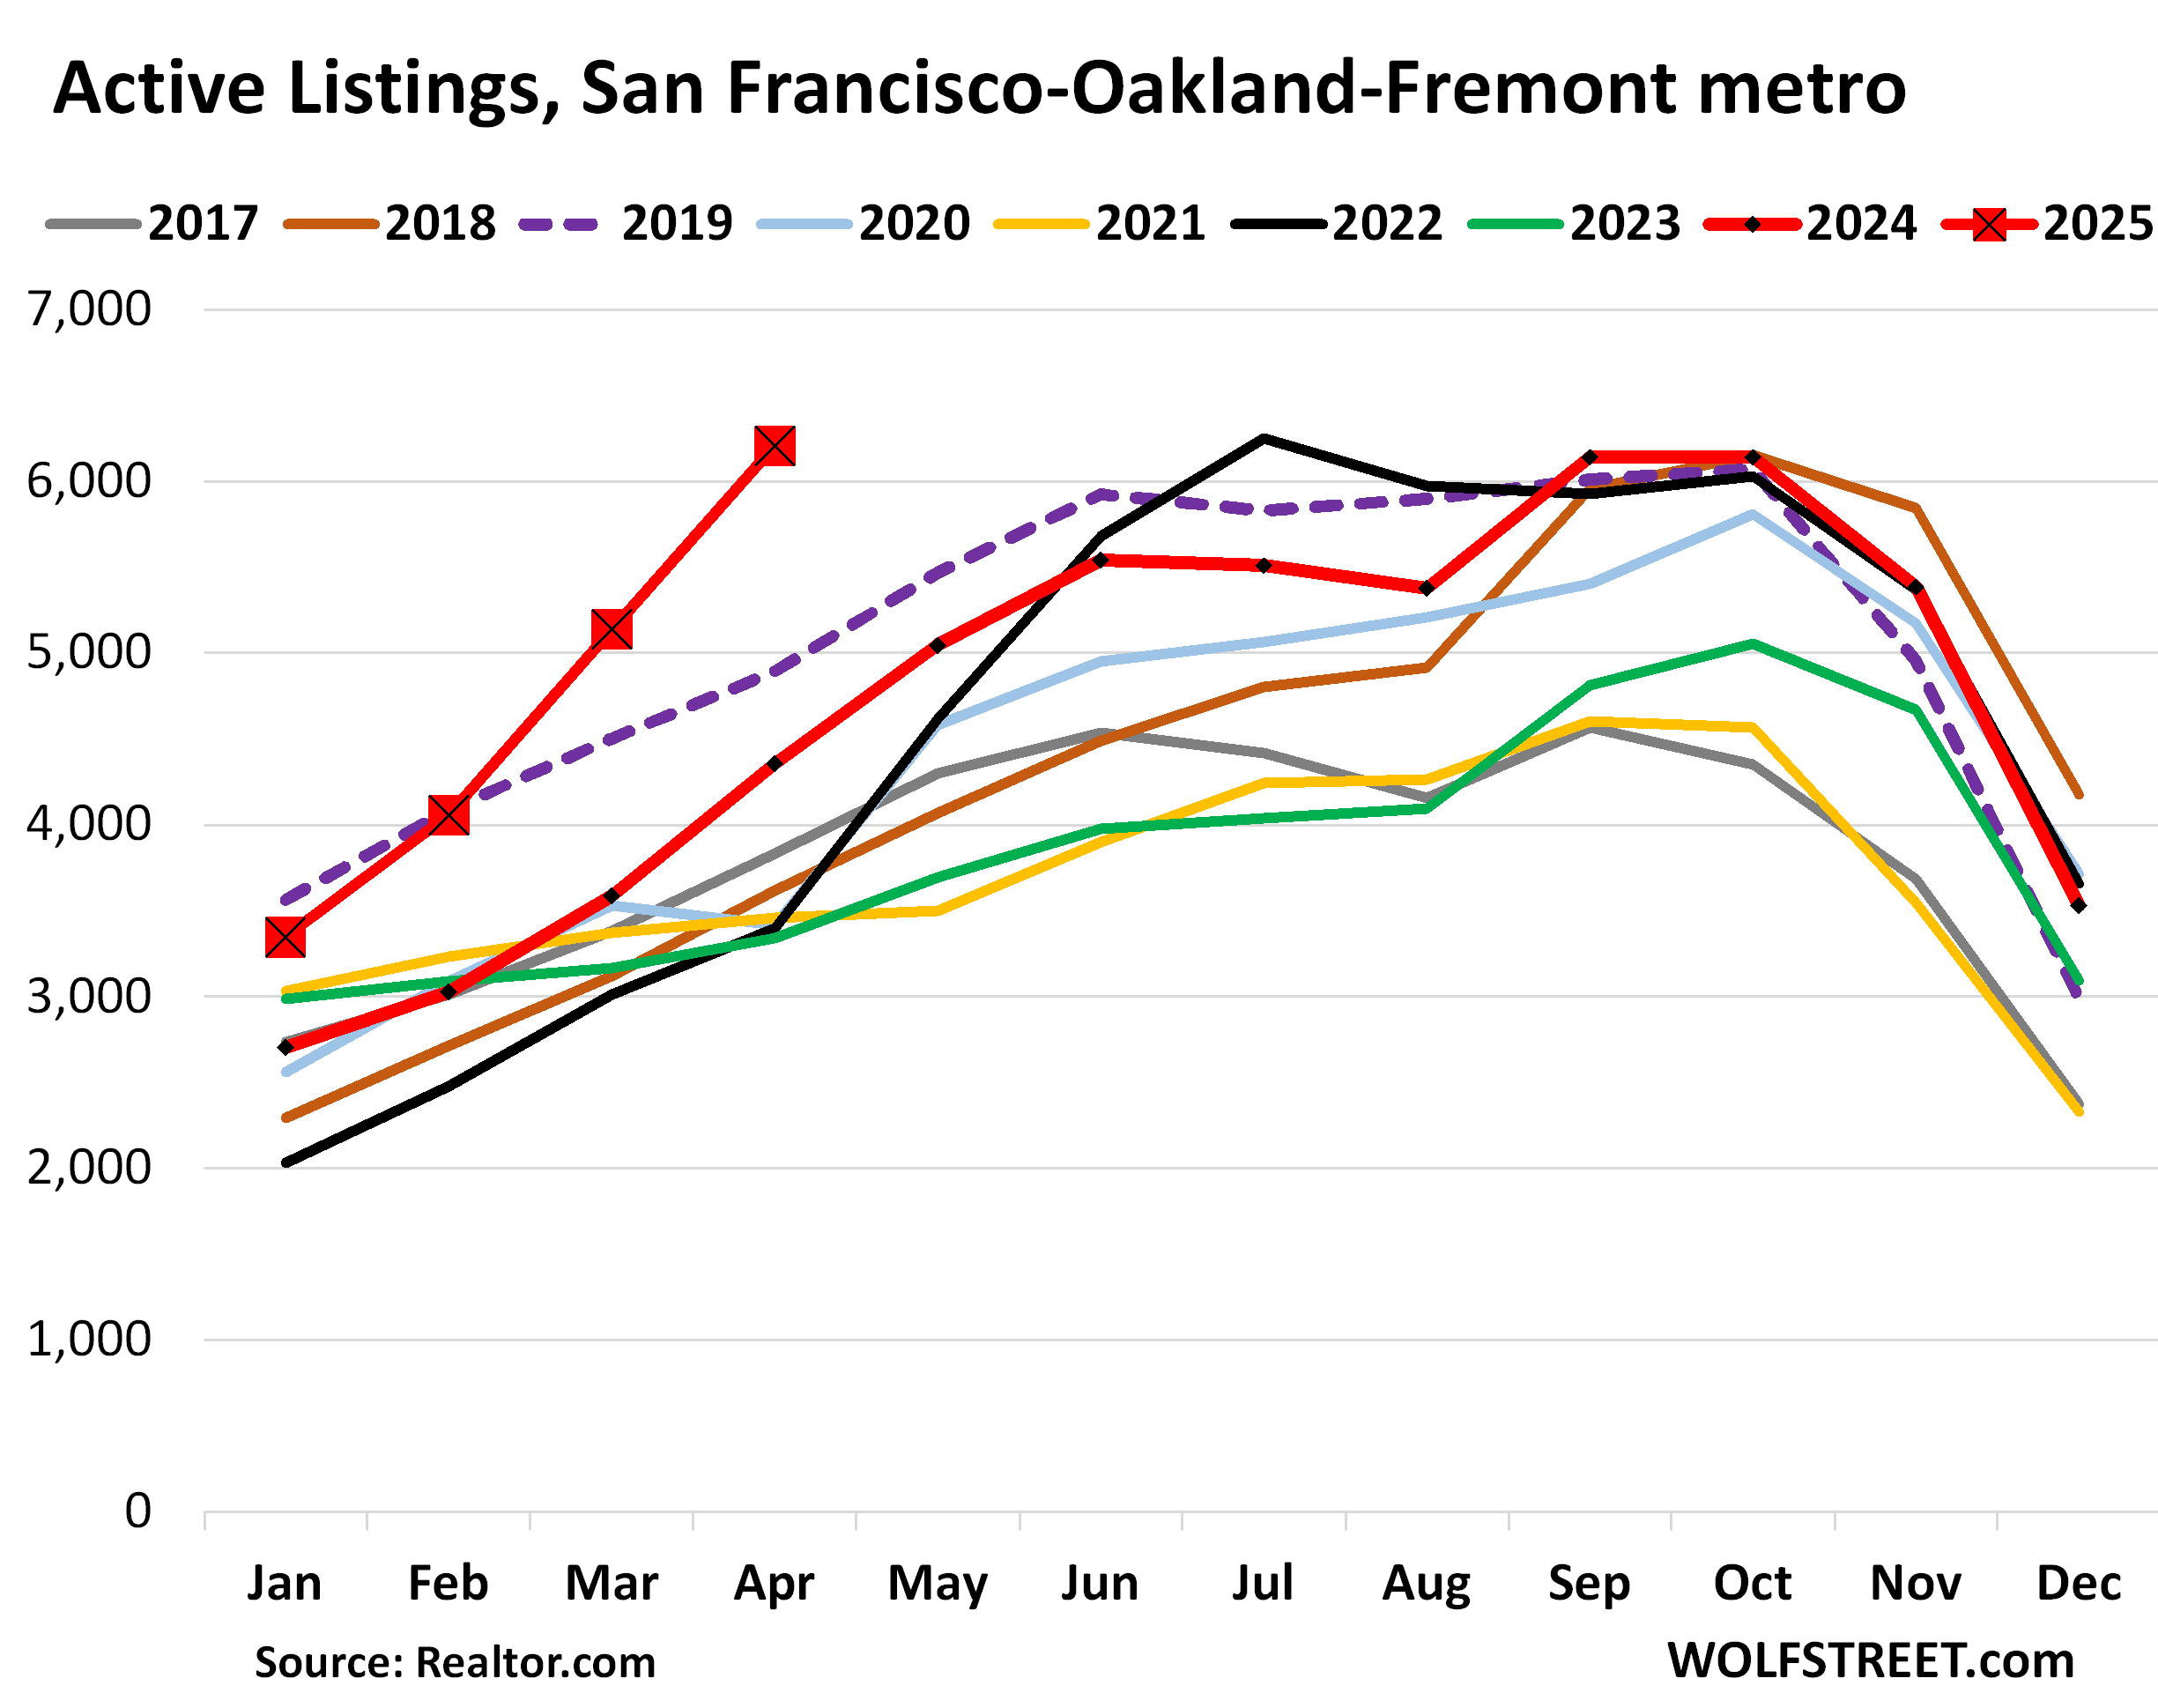
Active listings are homes for sale that do not have a pending sale. They’re the “unsold” inventory. Total inventory, on the other hand, includes active listings (unsold inventory) plus inventory with a pending sale (sold inventory).
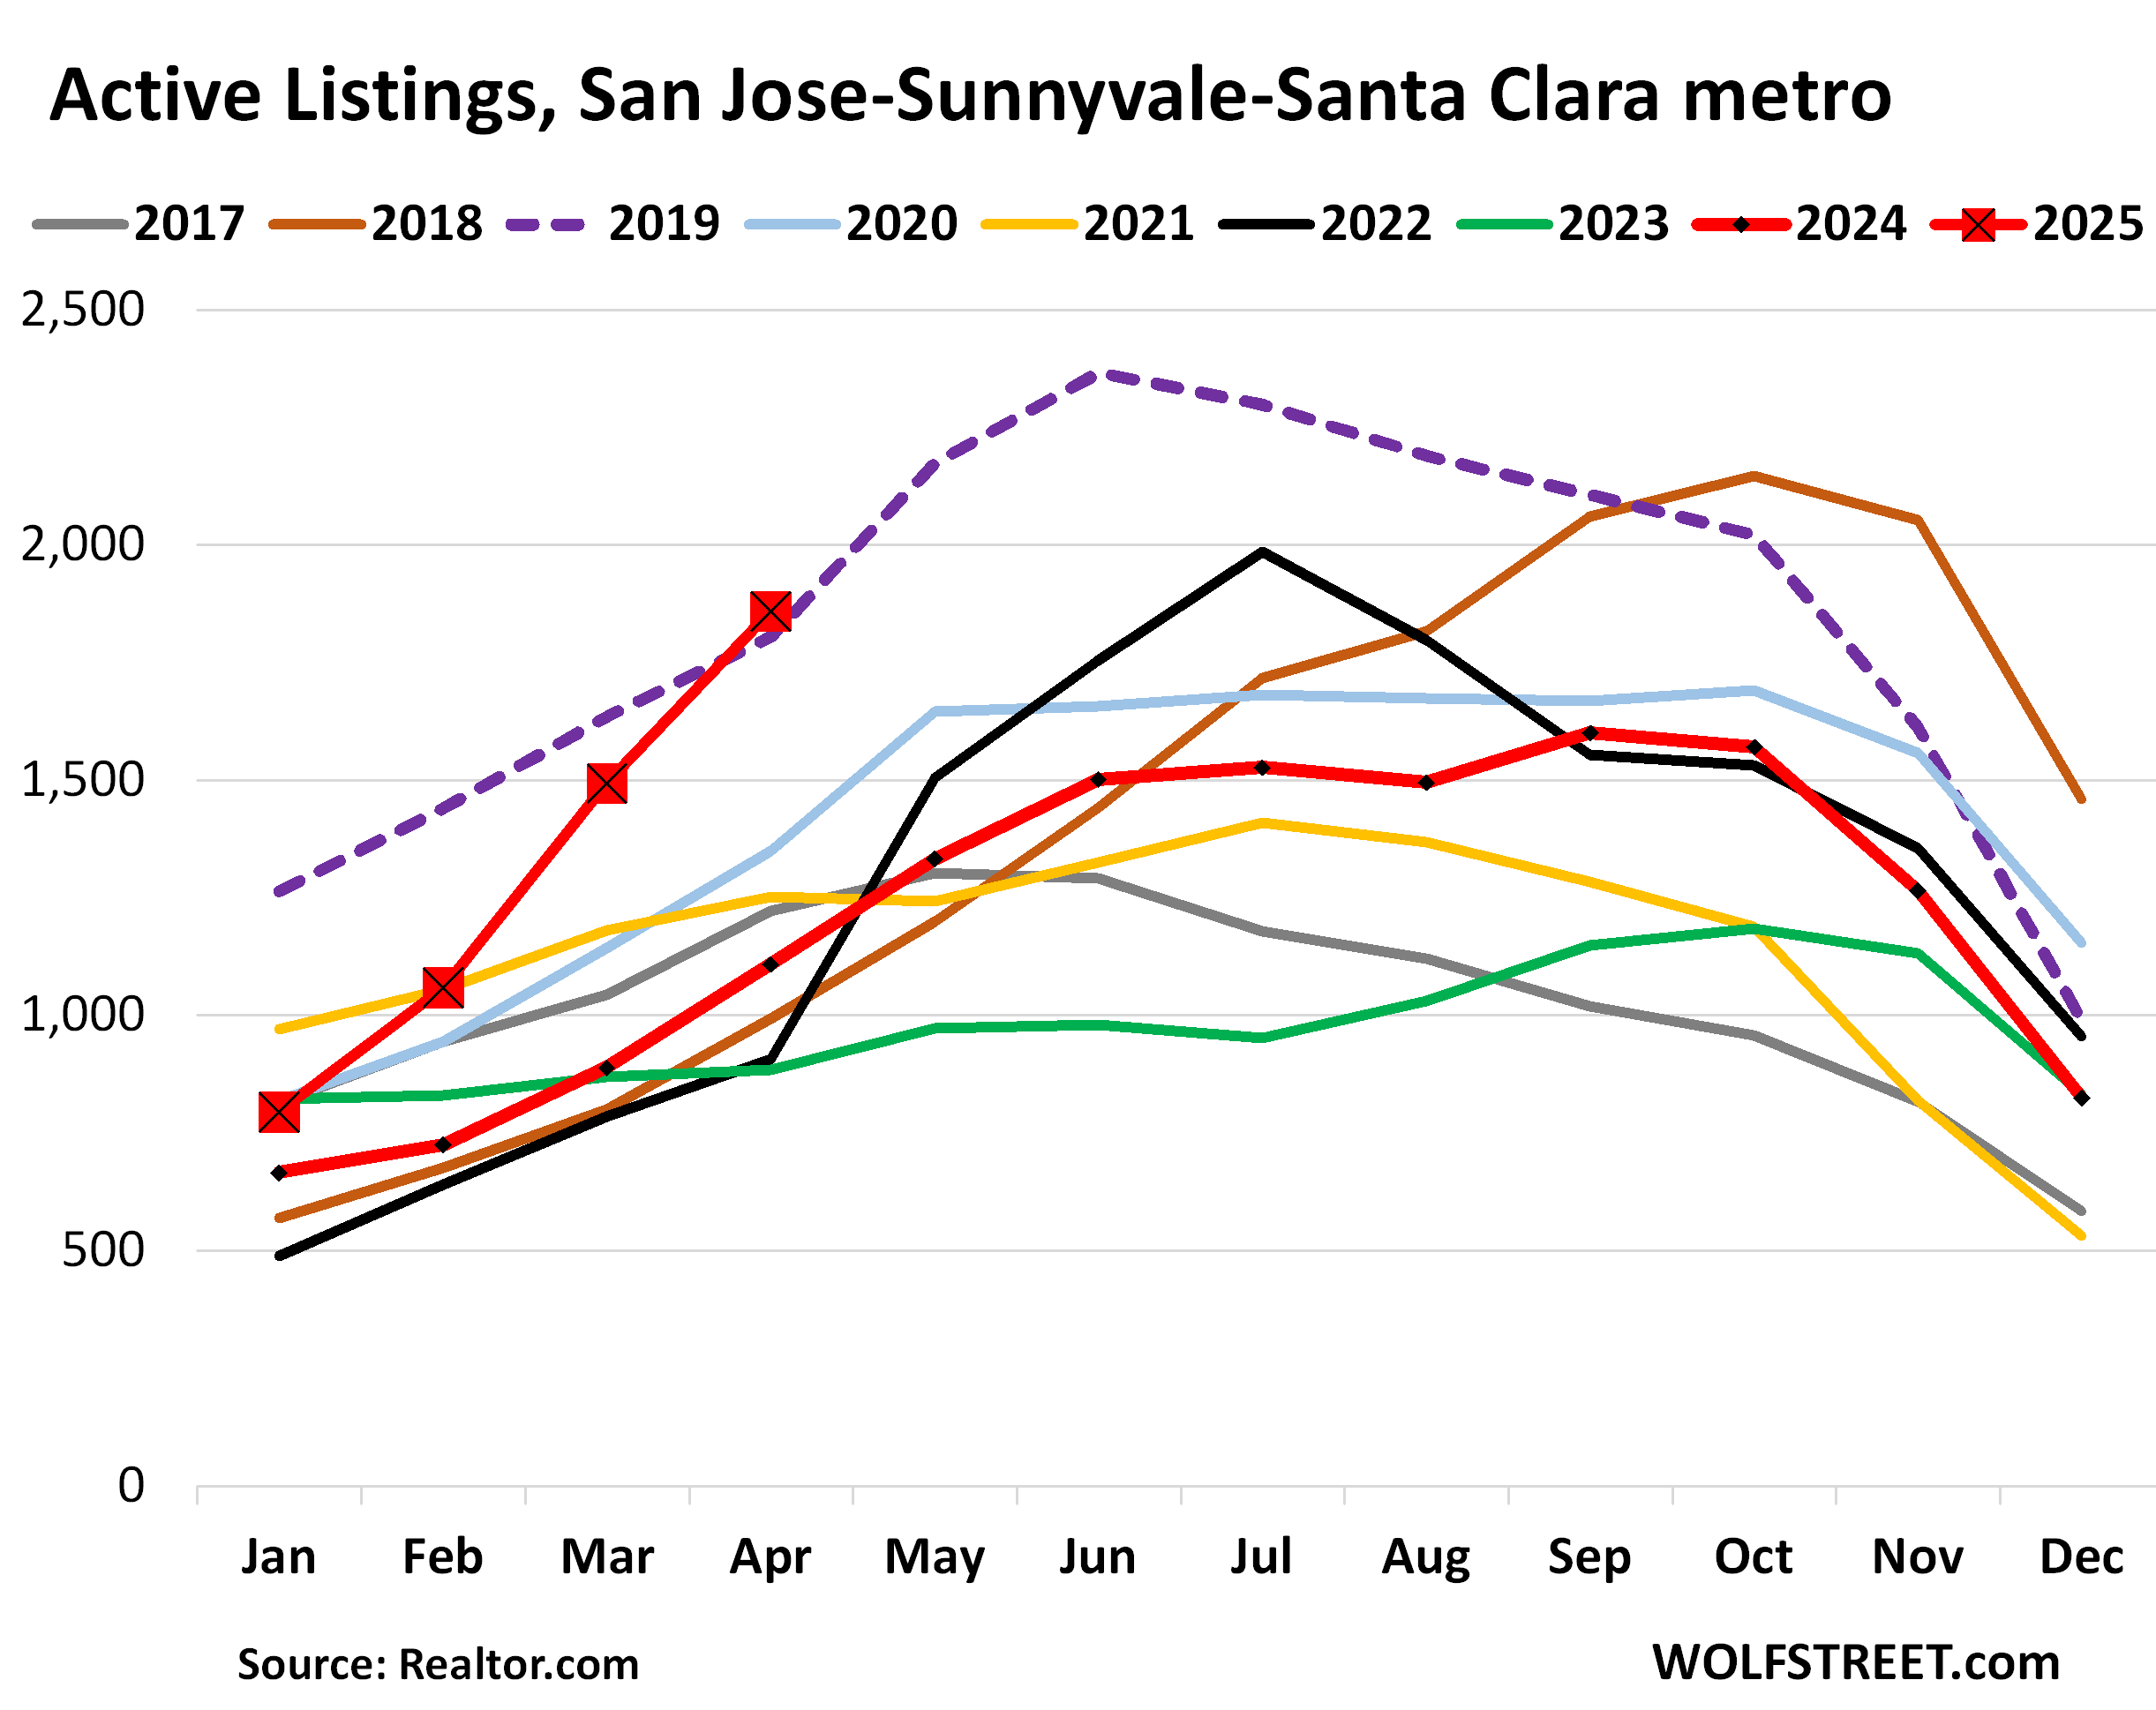
San Jose-Sunnyvale-Santa Clara metro: Active listings spiked by 68% year-over-year in April, after the three month-to-month spikes in April (+25%), March (+41%), and February (+33%). The 1,859 homes for sale were the most for any April in the data from realtor.com going back to 2016.
Compared to April 2019, active listings were up by 3%. In April 2024, active listings were still down by 39% from April 2019. That’s how fast inventory changed.
The MSA includes Santa Clara County (San Jose and the southern part of Silicon Valley) and goes south into rural areas.
In late 2018, the average 30-year fixed mortgage rate rose to 5%, after having surpassed 4% earlier in 2018, and home sales stalled, and inventories rose sharply in the second half of 2018 (brown line) and into 2019 (dotted purple line). It’s this inventory pileup of 2019 that the current inventory has now surpassed:
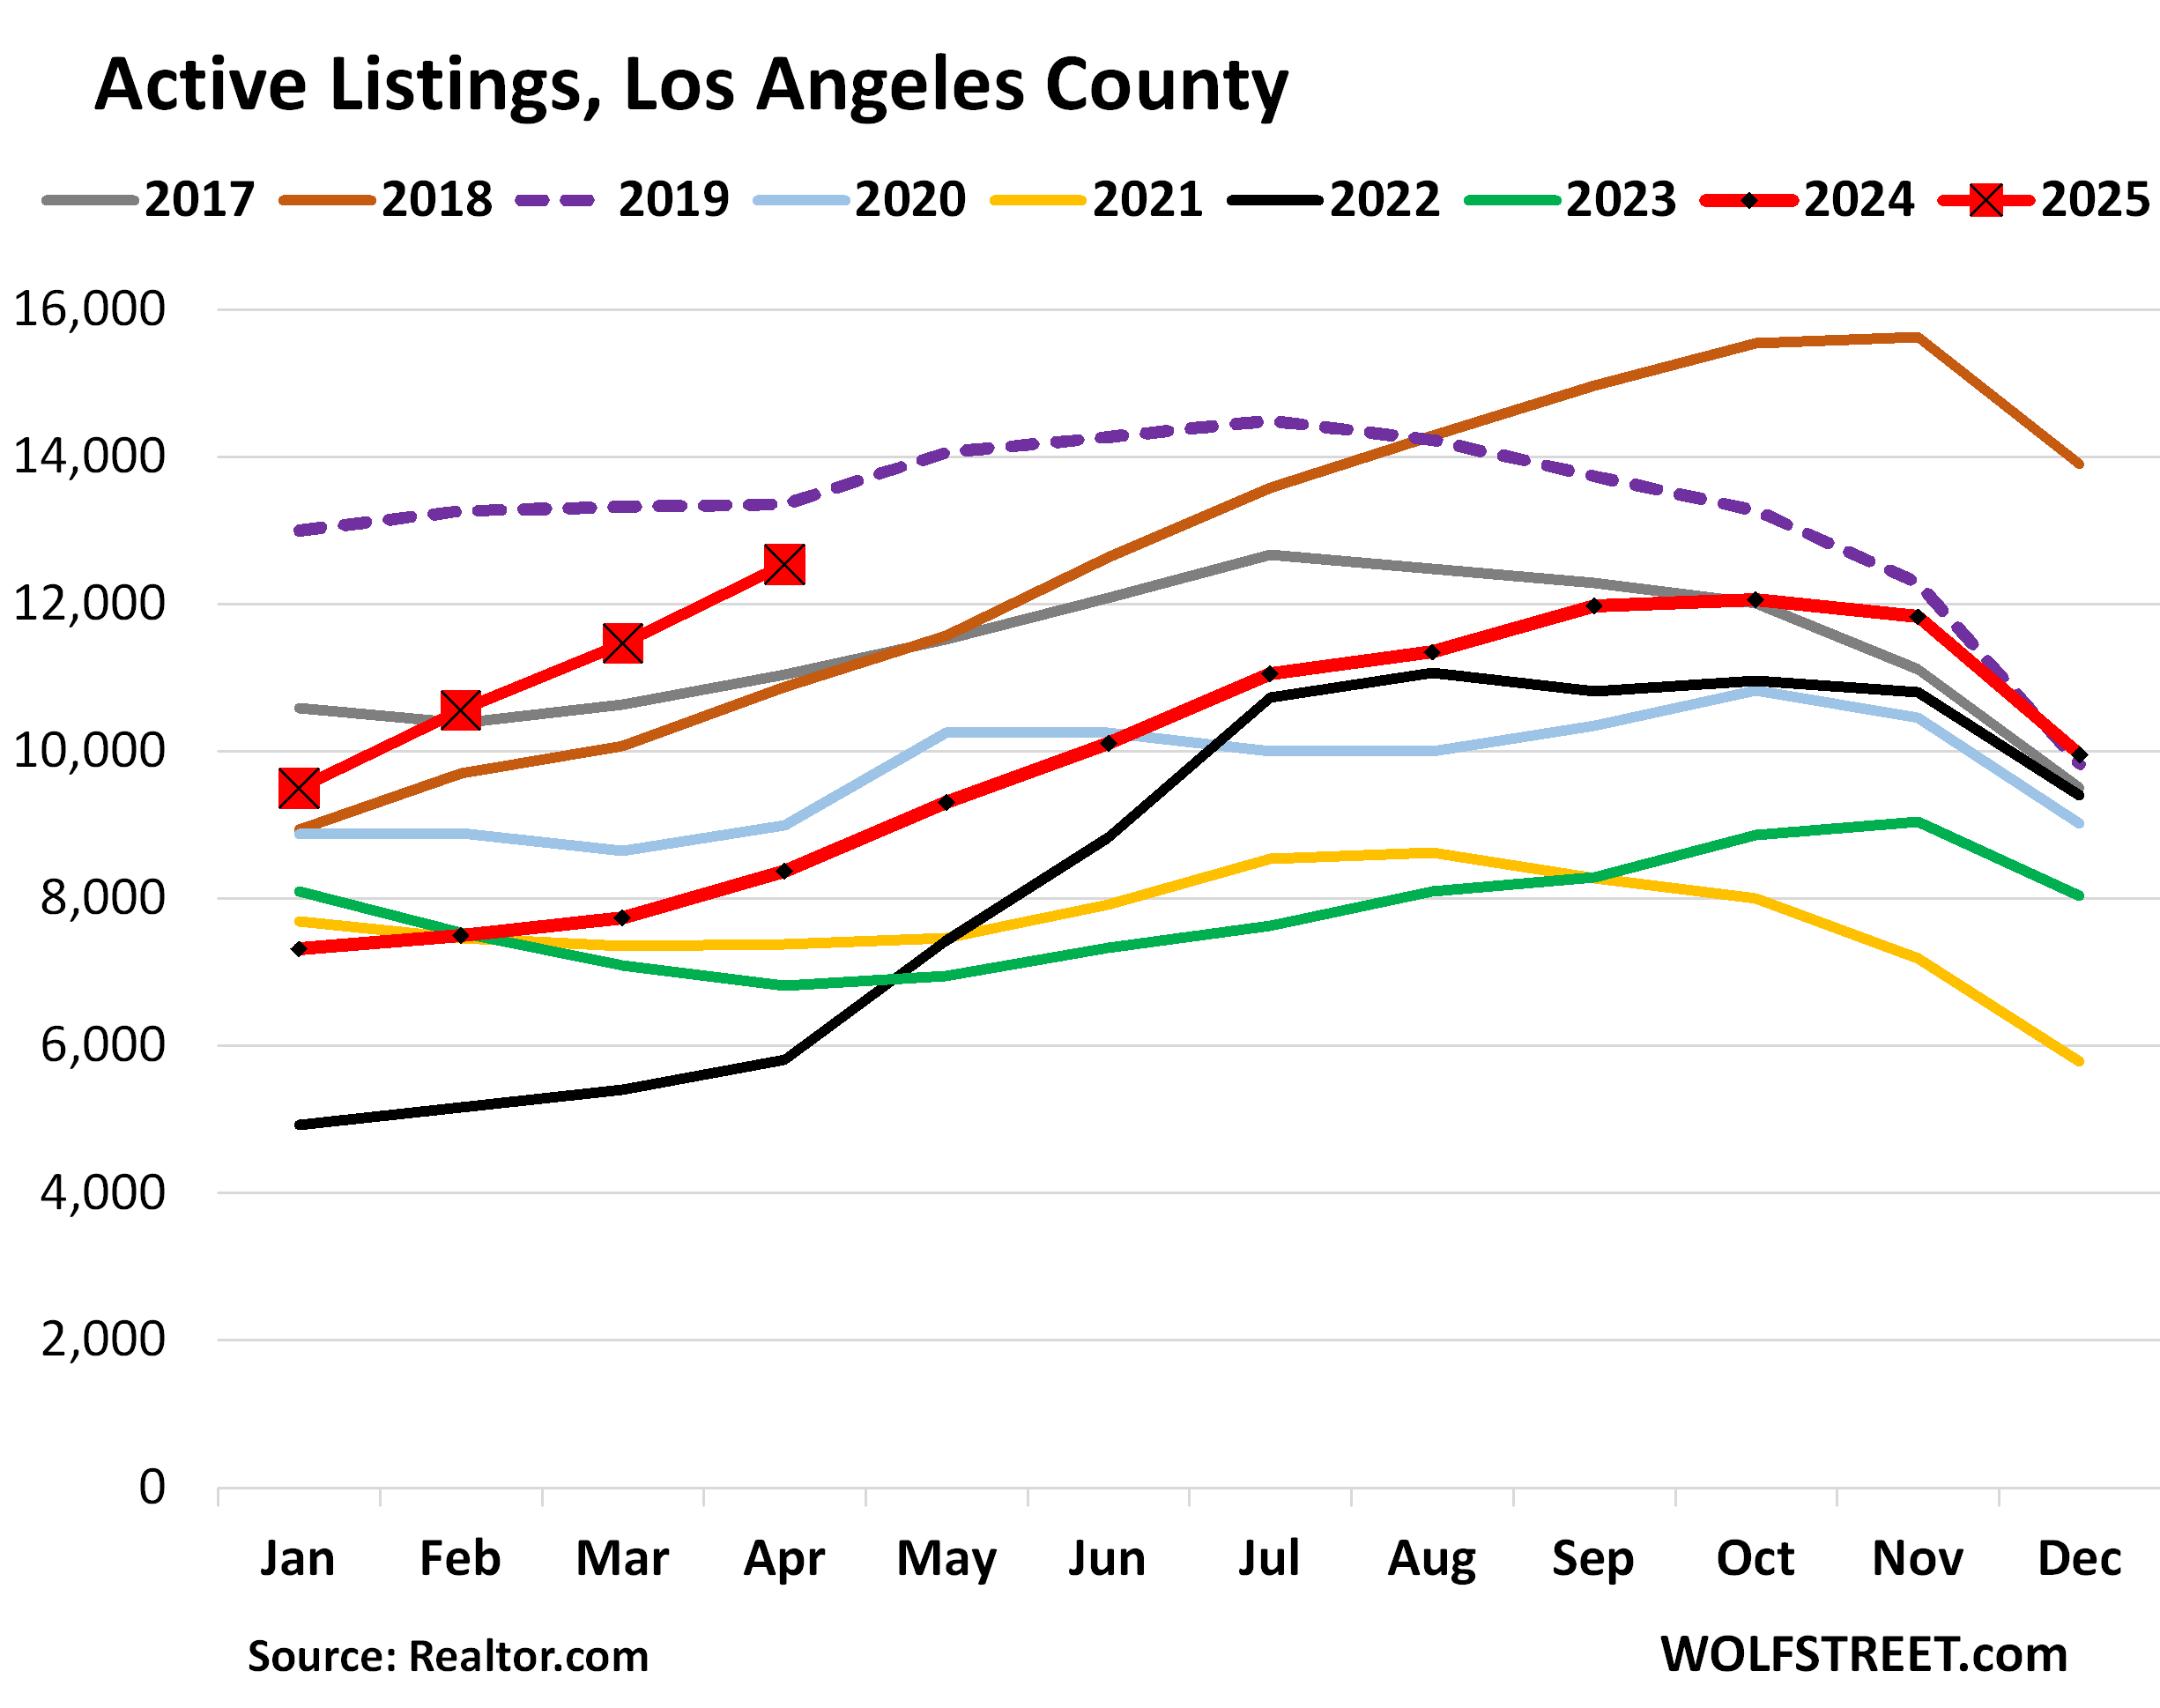
Los Angeles County: Active listings spiked by 50% year-over-year in April, to 12,535 homes for sale, the most for any April in the data from realtor.com going back to 2016, except 2019 (purple dotted line).
Active listings were 6% below April 2019, but have been rapidly catching up, from being 27% below in January, and given the trend in 2025 so far, may surpass 2019 over the next few months.
Note the inventory pile-up in the second half of 2018 (brown line), when mortgage rates hit 5%, and into 2019. That’s the inventory level that 2025 is now lining up to surpass.
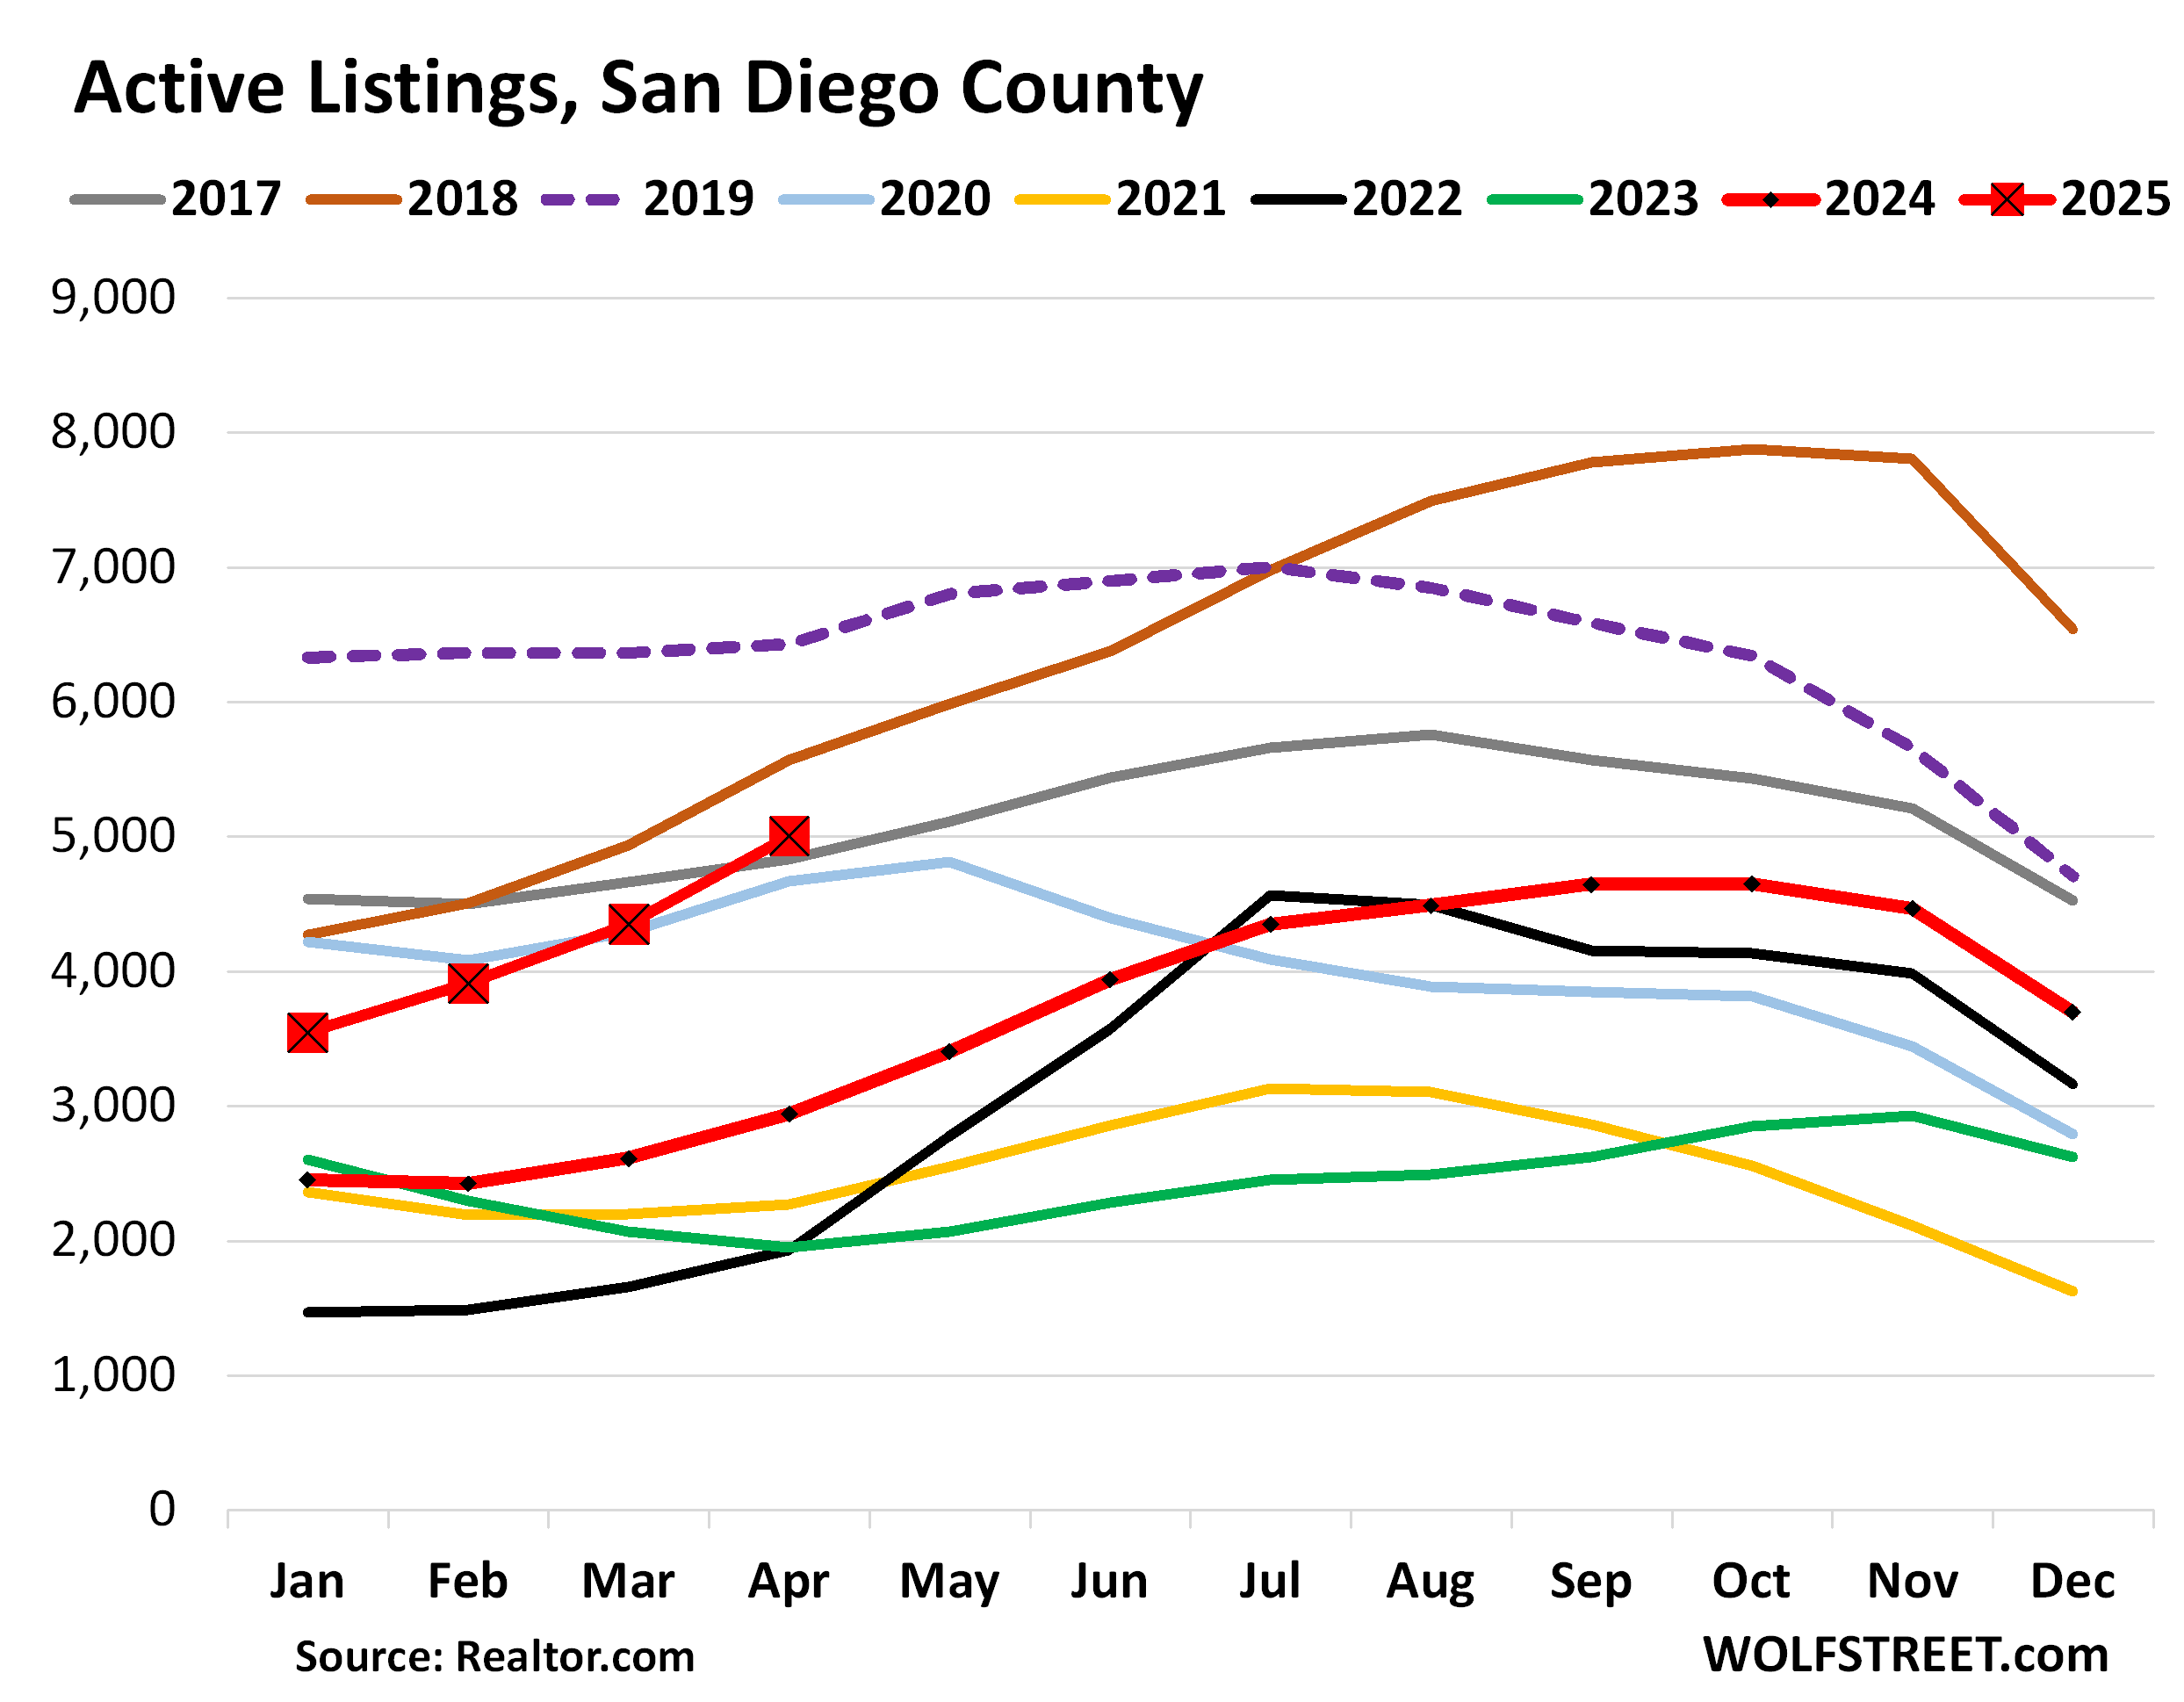
San Diego County: The surge of active listings got a late start, but it’s making up with a vengeance. Active listings spiked by 70% year-over-year, to 5,004 homes for sale, the highest for any April since 2019 and 2018, but higher than 2017, in the data going back to 2016.
Compared to 2019 (dotted purple line), active listings in 2025 halved the gap over the past four months, from being 44% below in January to being just 22% below in April.
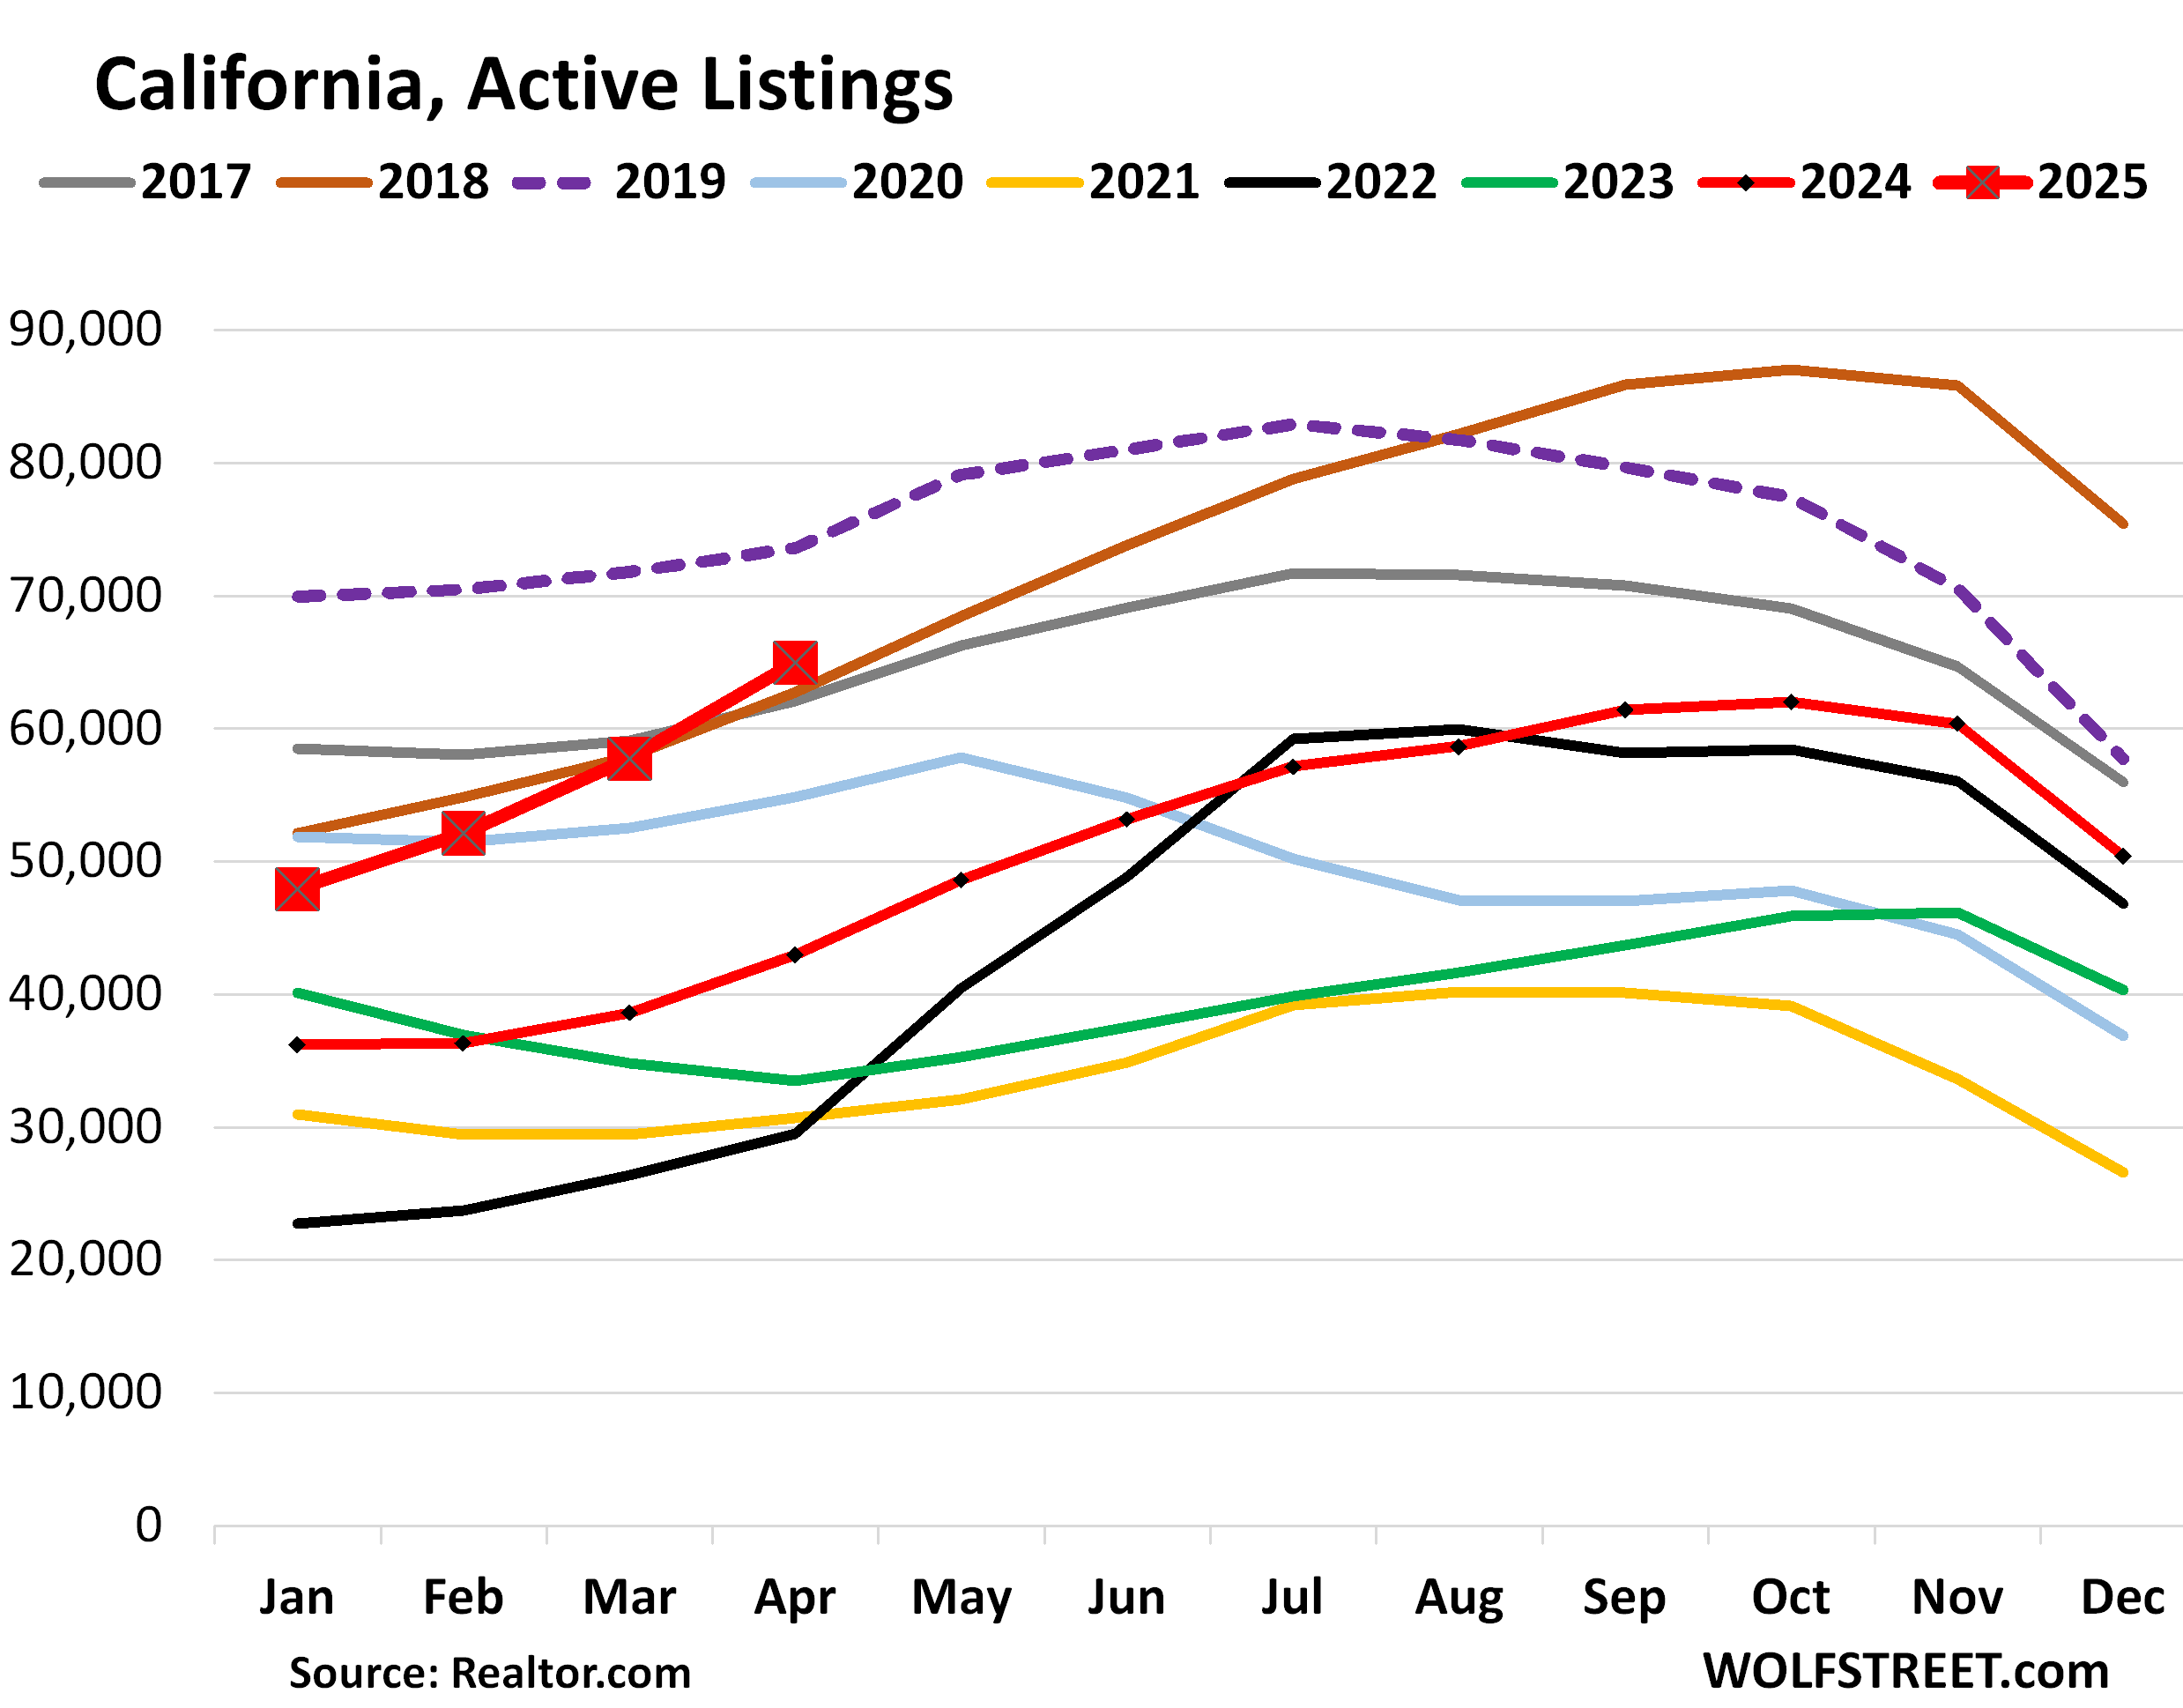
State of California: Active listings spiked by 51% year-over-year, to 64,963 homes, the highest for any April in the data going back to 2016, except 2019 (dotted purple line).
Compared to 2019, active listings in 2025 went from being 32% below in January, to being just 12% below in April.
Not every market moves in lockstep, some are the first movers, others lag behind, but the inventory pile-up is now starting to play out all major urban areas in the state.
Obviously, a flood of inventory on the market is a good thing for this broken and frozen market of existing homes – it’s broken and frozen nationwide, with a generational multi-year plunge in sales volume – and maybe it can jar the market loose finally.
Enjoy reading WOLF STREET and want to support it? You can donate. I appreciate it immensely. Click on the mug to find out how:

![]()
The post California Inventory of Homes for Sale Suddenly Piles Up: +51% Year-over-Year, to Highest April in Years appeared first on Energy News Beat.
“}]]