
[[{“value”:”
By Wolf Richter for WOLF STREET.
You read the headlines today: Retail sales, seasonally adjusted, fell by 0.9% in January from December. Winter storms, fires, the consumer collapsed, whatever. But what we’re actually looking at here are… massive seasonal adjustments.
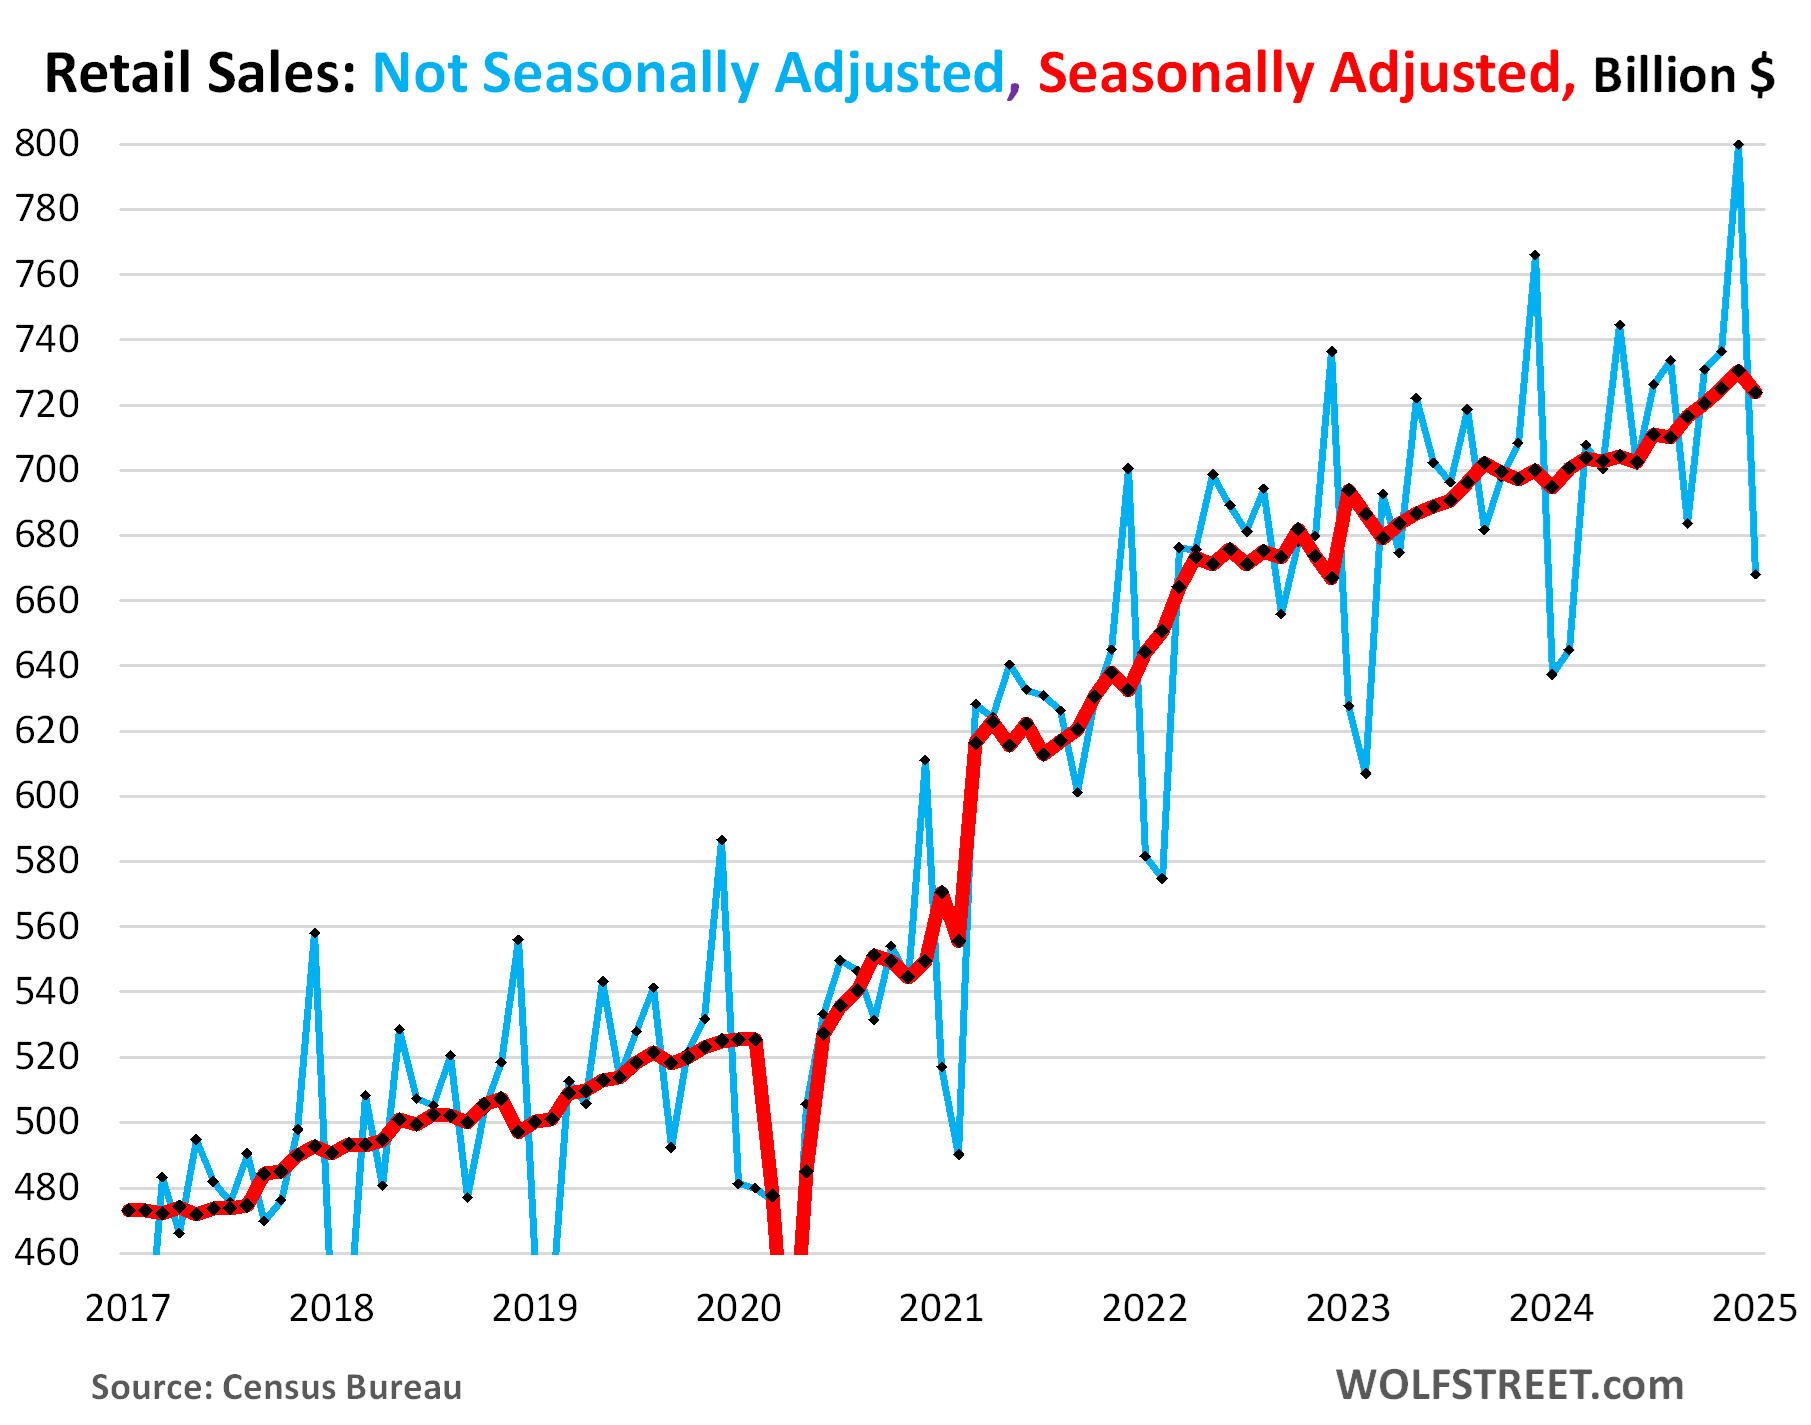
Not seasonally adjusted, retail sales were up 4.8% year-over-year, but month-to-month plunged by 16.5%, or by $132 billion, to $668 billion in January, from December’s record and upwardly revised $800 billion. Confused yet about whether retail sales in January were good or bad? Yup, it’s the time of the year again to do a romp through seasonal adjustments.
Not seasonally adjusted, retail sales always plunge from December, the best month of the year, to January and February, the worst months of the year – this time by 16.5% in January from December, according to the Census Bureau today. Over the past 20 Januarys, retail sales plunged by 15% to 22% from December. This January was less bad than most: There were only two Januarys with smaller plunges: in 2023 (-14.8%) and in 2021 (-15.4%). The rest of the Januarys experienced bigger plunges.
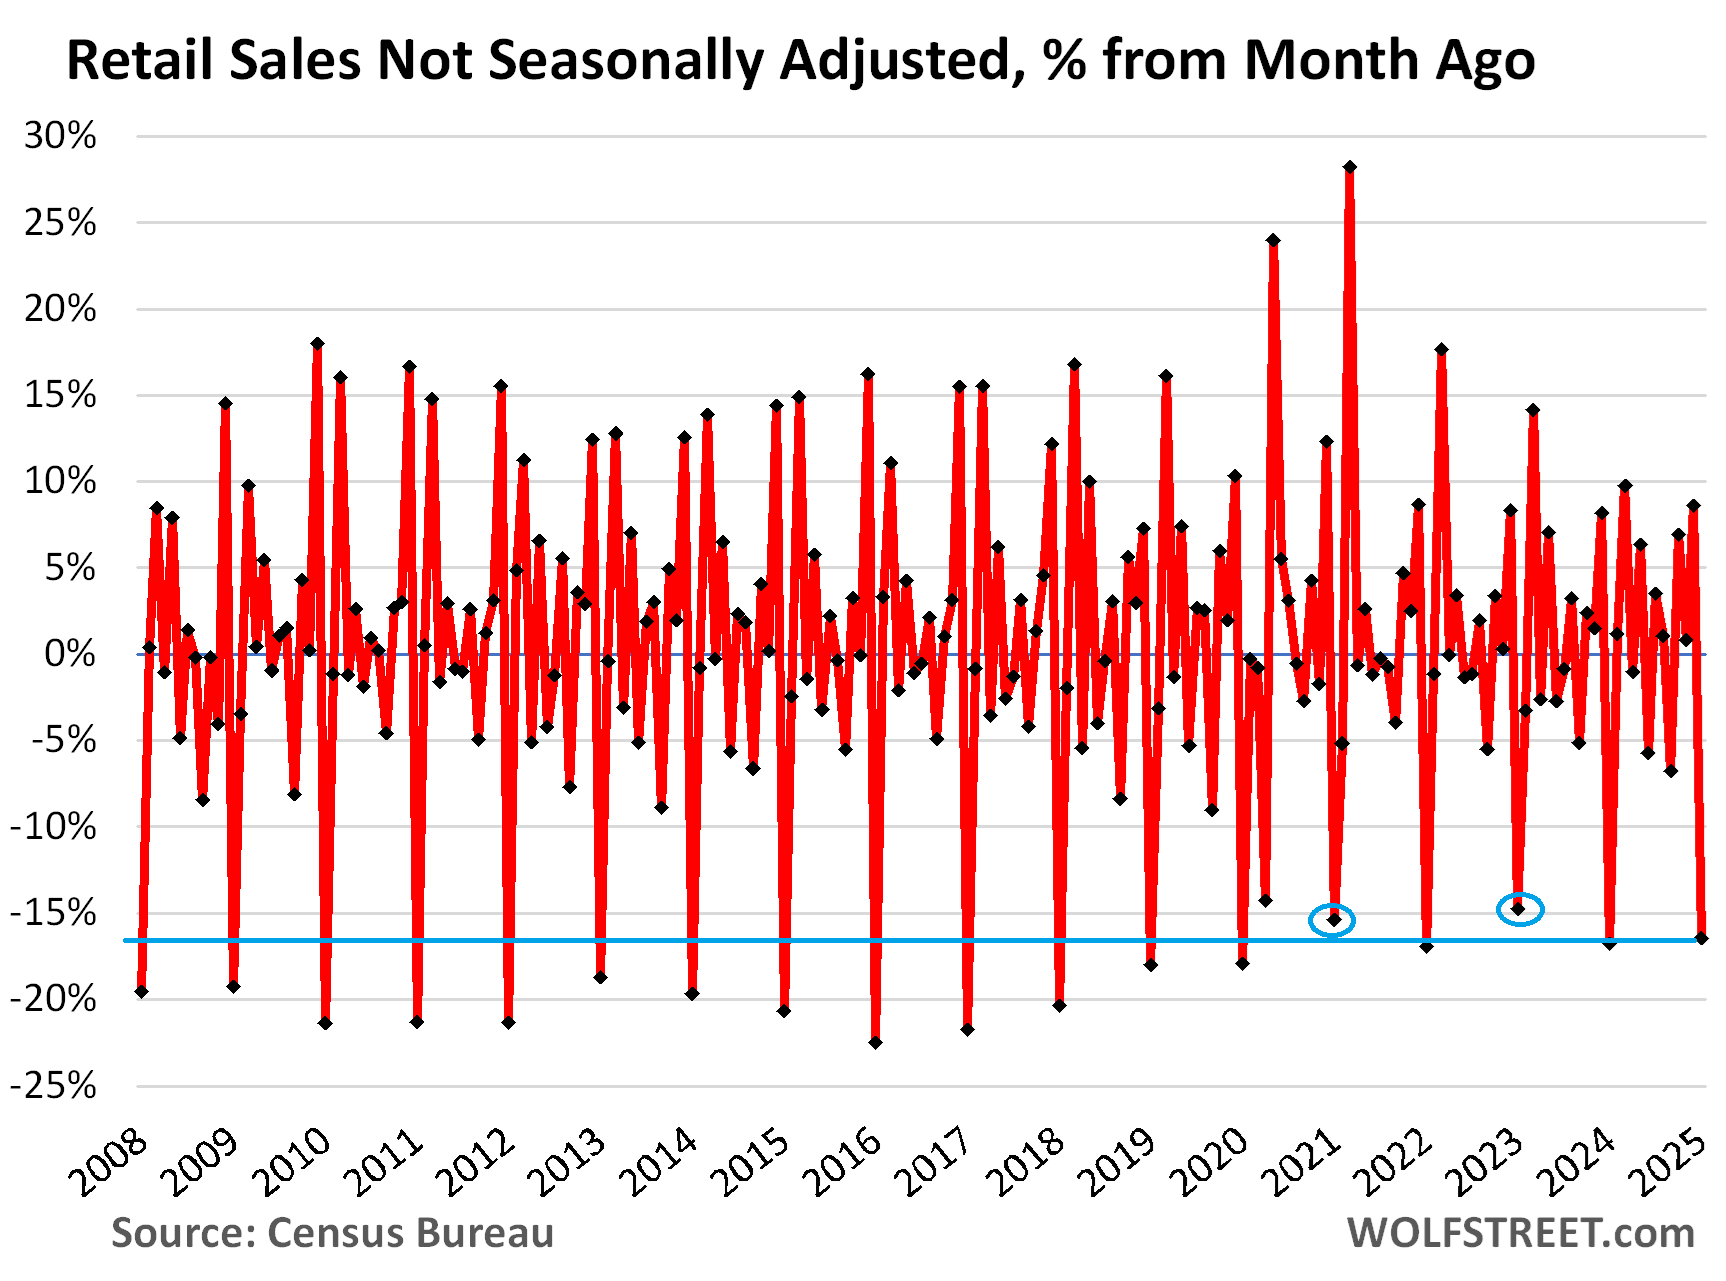
Retail sales are hyper-seasonal. In December, retail sales explode. In January, retail sales implode, and retailers deal with the hangover. Gift-buying and holiday-spending is over, and here come the returns (negative sales).
For department stores, sales in January collapse by 40% to 50% from December. This January, they collapsed by 44.4%, but that was less than last year’s 46.0% collapse and less than the 48.4% collapse two years ago. Other retailers see less of a drop.
Huge seasonal adjustment factors are used to reduce December sales and to increase January and February sales, with the purpose of leveling them out (NSA = not seasonally adjusted; SA = seasonally adjusted).
December:
- NSA sales: $800 billion
- SA sales: $730 billion
- Seasonal adjustment: -$70 billion.
January:
- NSA sales: $668 billion
- SA sales: $724 billion
- Seasonal adjustment: +$56 billion.
The seasonal adjustment factor attempts to account for seasonal variations and differences in “trading days” and how holidays fall. For example, Christmas Day, when most stores are closed, fell on a Wednesday. In years when it falls on a Sunday, there’s an extra trading day in December that needs to be adjusted out. The Census Bureau’s X-13 ARIMA-SEATS software program calculates these seasonal adjustment factors, based on numerous historical data points.
- NSA: -16.5% month-to-month, to $668 billion, +4.8% year-over-year
- SA: -0.9% month-to-month, to $723 billion, +4.2% year-over-year:
Seasonal adjustments at the Big Three.
Sales at auto & parts dealers, at nonstore retailers (mostly ecommerce), and at food services and drinking places (restaurants, bars, cafes, cafeterias, etc.) combined account for over half of total retail sales. And they have different seasonal patterns. But Januarys stink at all of them.
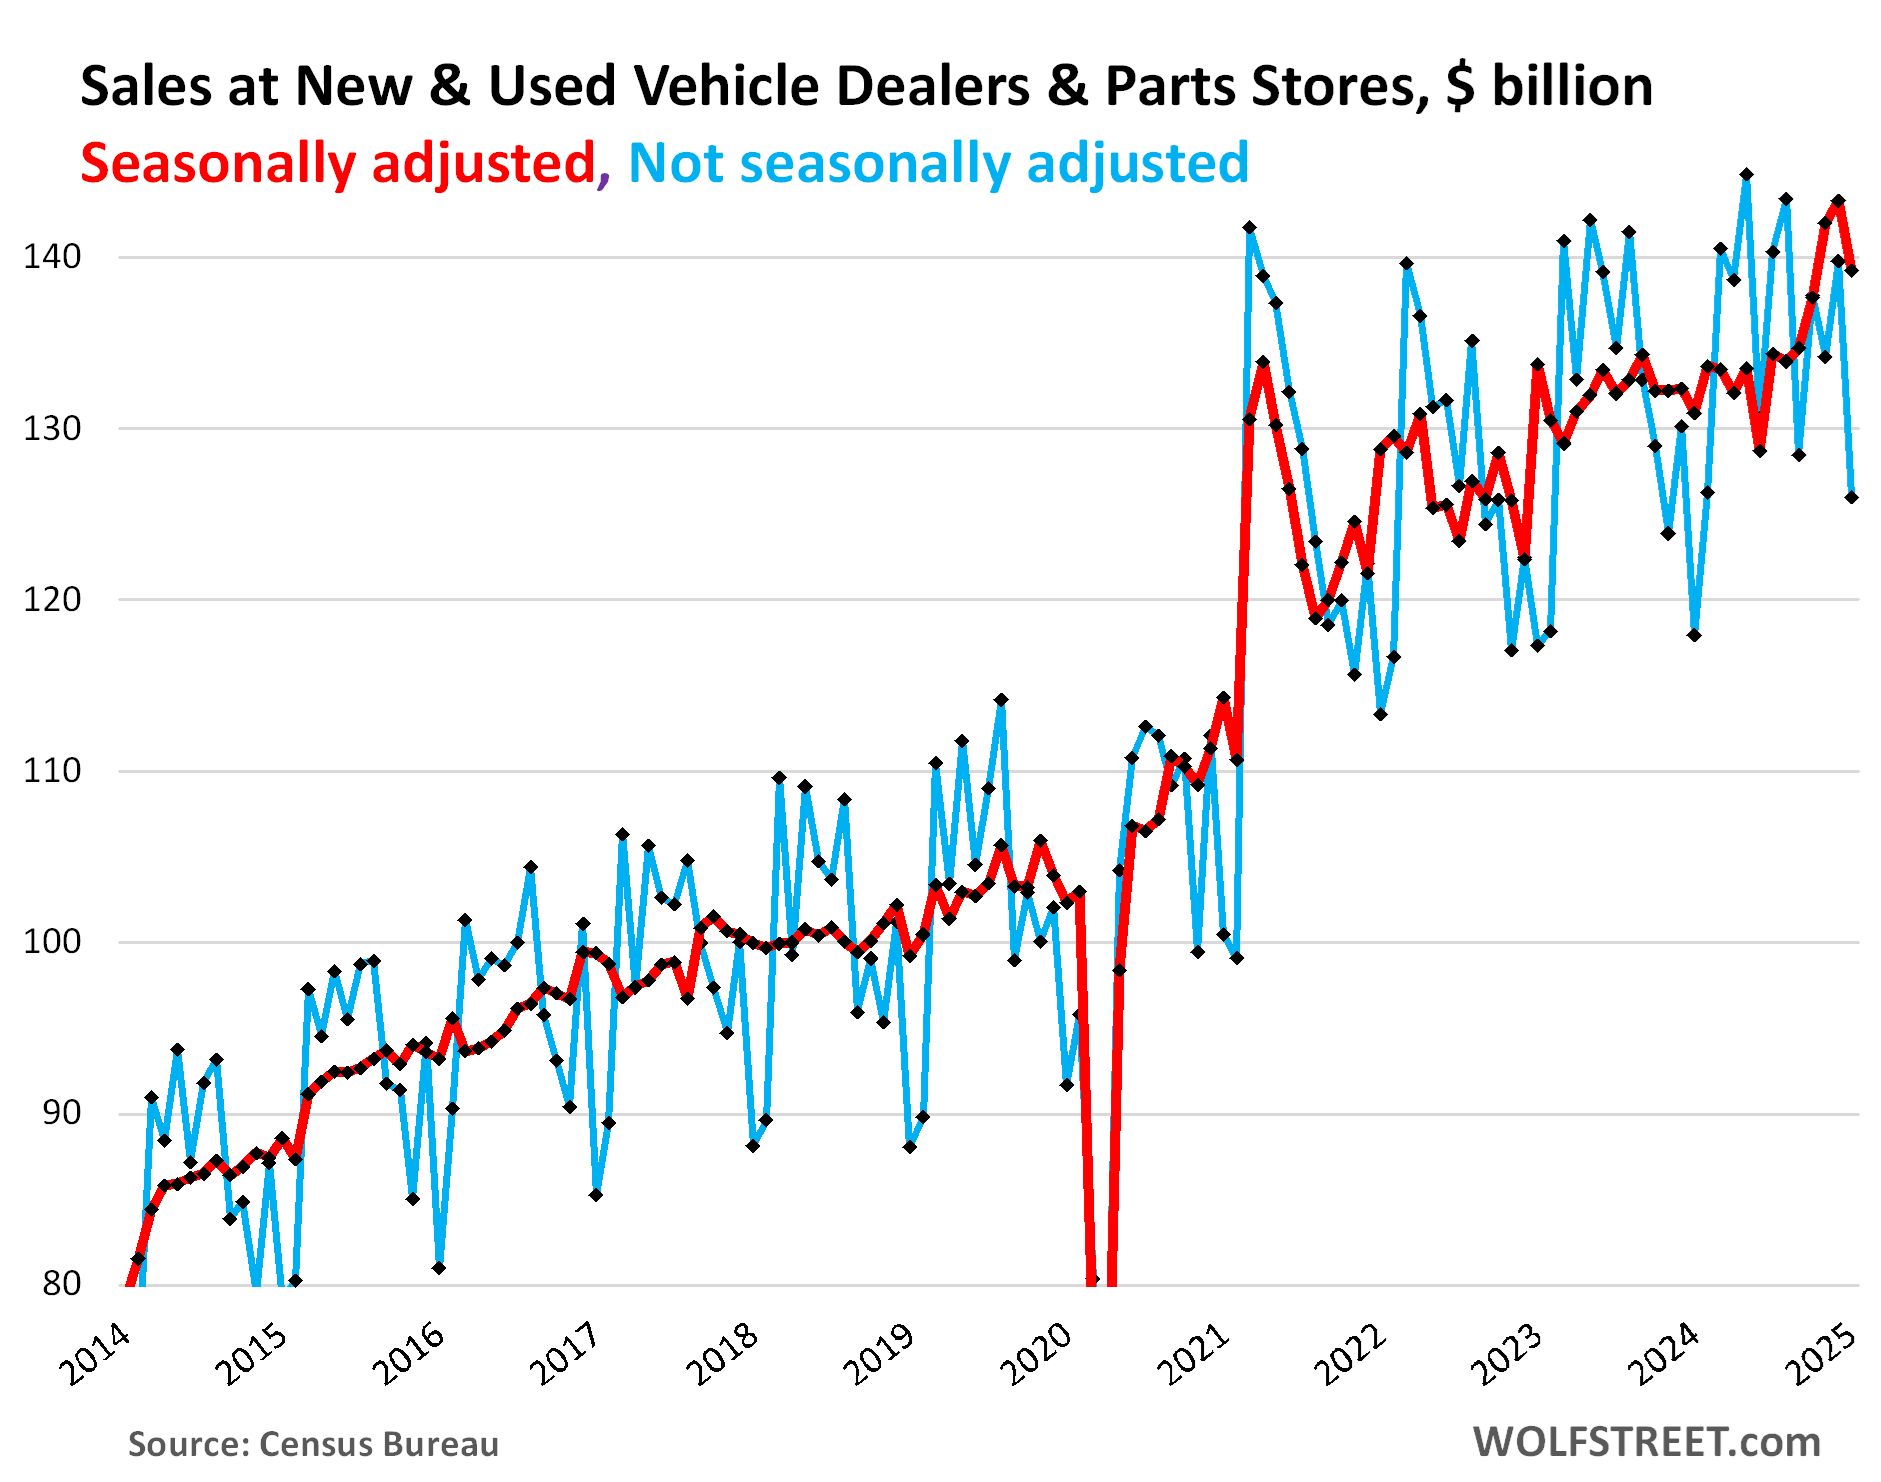
For auto dealers, the best month of the year is in the spring or summer. One of the months from March through August is typically the peak of the year. Decembers are middle-of-the-road. And Januarys are the worst, they just suck. And February is not much better. But in March, the floodgates open. That’s the rhythm with auto sales, they did that in my time, and they still do.
This January:
- NSA sales: -9.9% month-to-month, +6.8% year-over-year.
- SA sales: -2.8% month-to-month, +6.4% year-over-year.
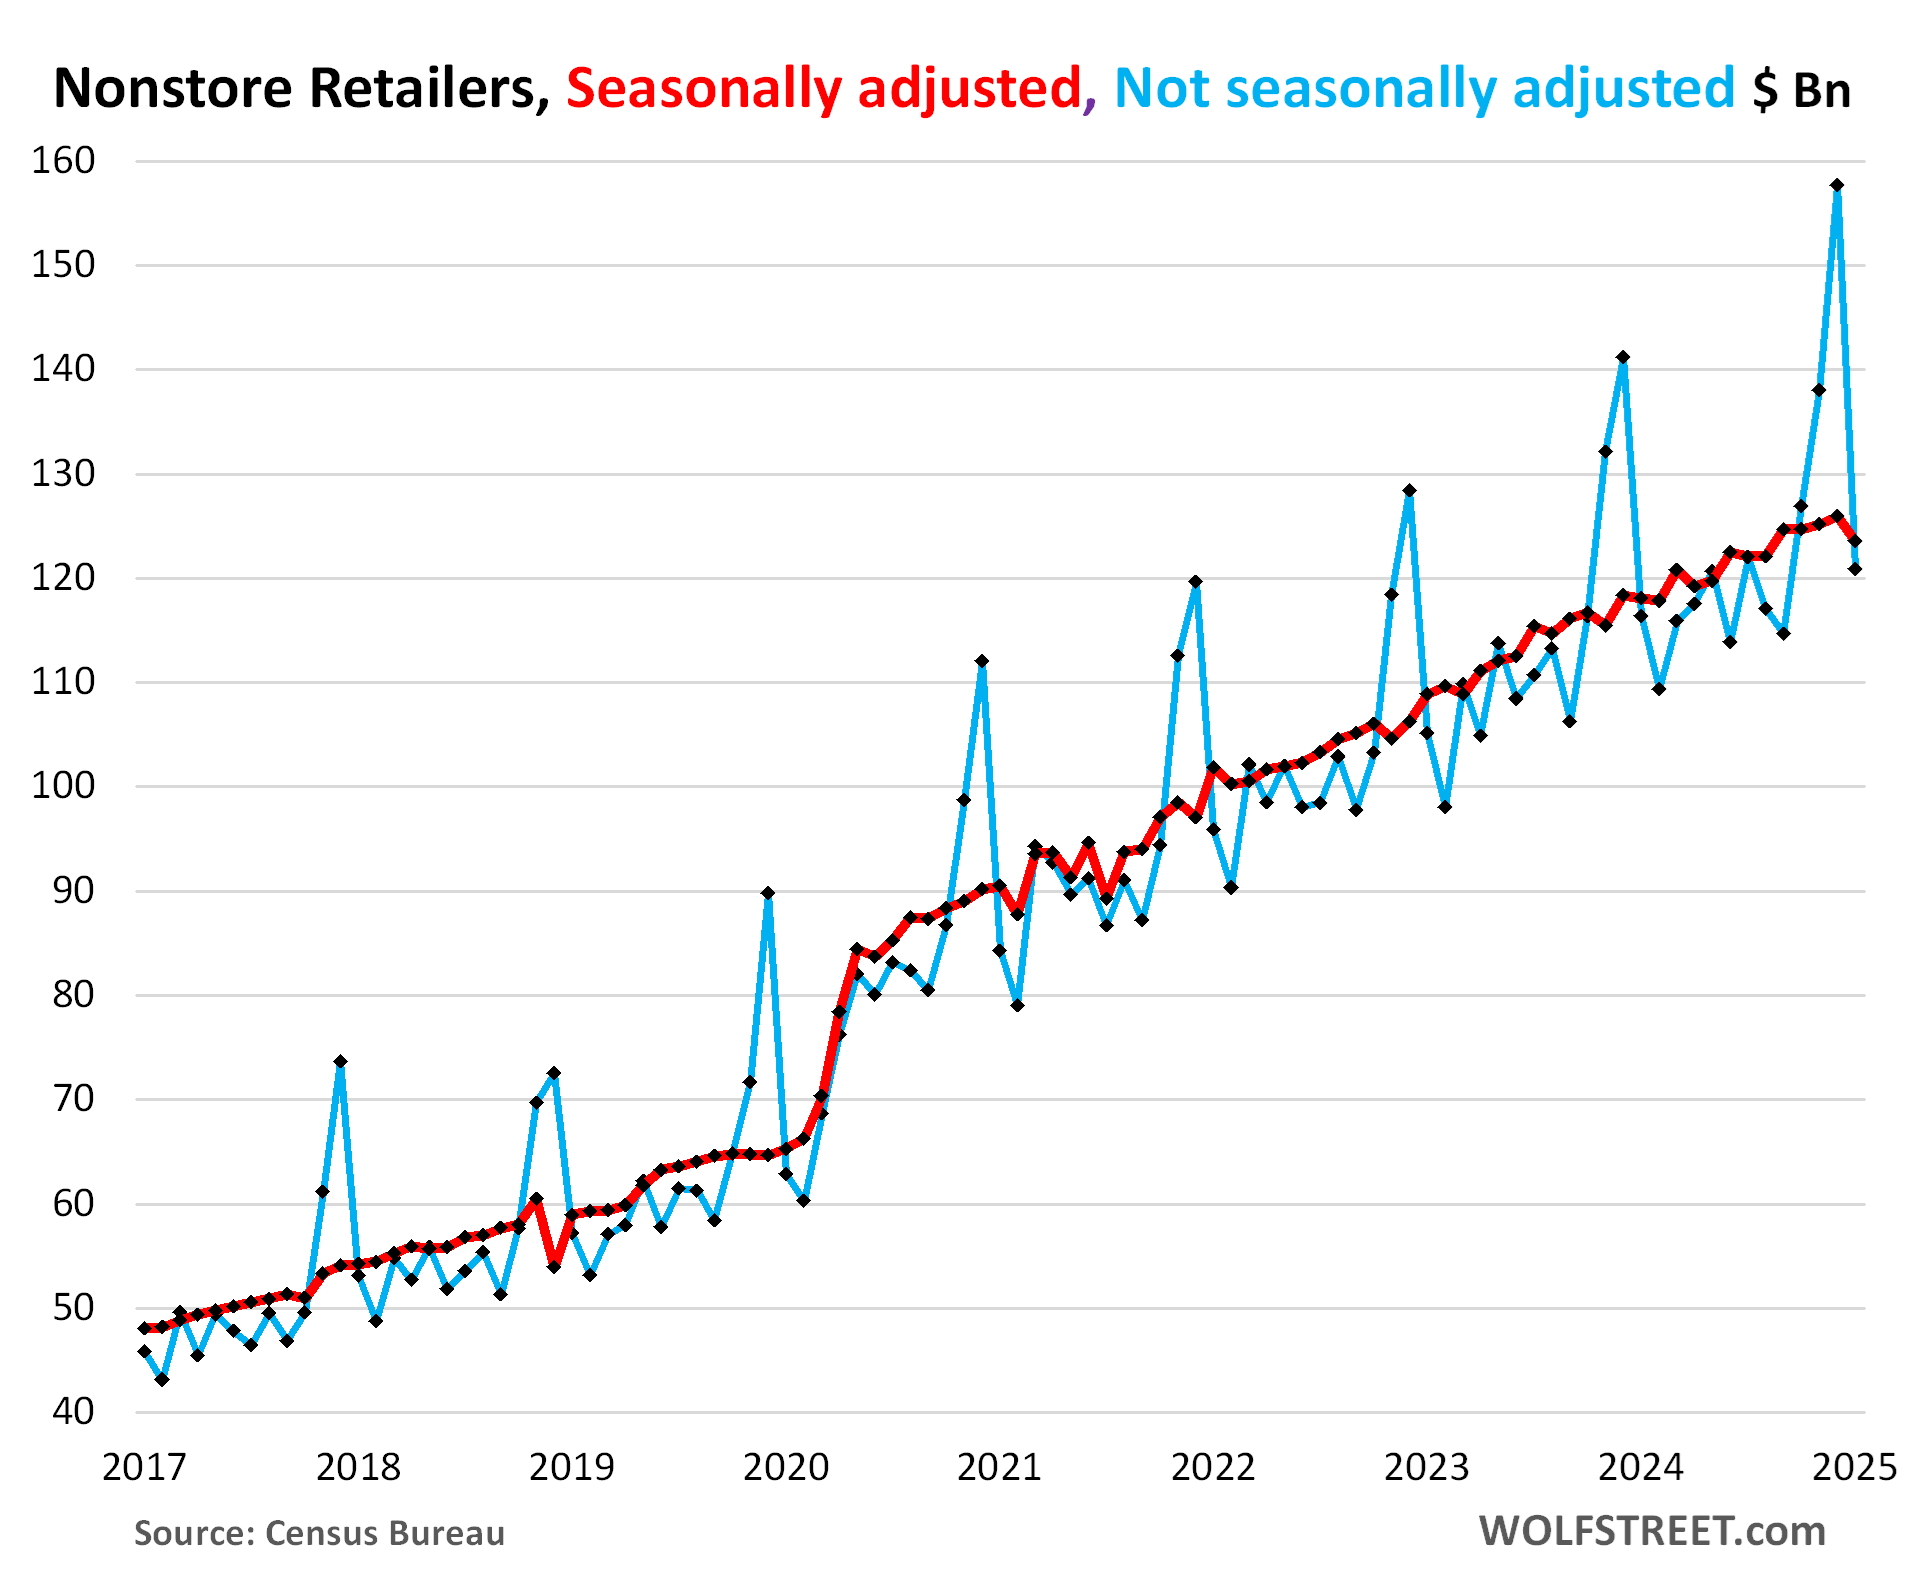
For nonstore retailers (mostly ecommerce), the best month by far is December, while January or February is the worst month of the year.
This January:
- NSA sales: -23.3% month-to-month, +3.8% year-over-year.
- SA: -1.9% month-to-month, +4.7% year-over-year.
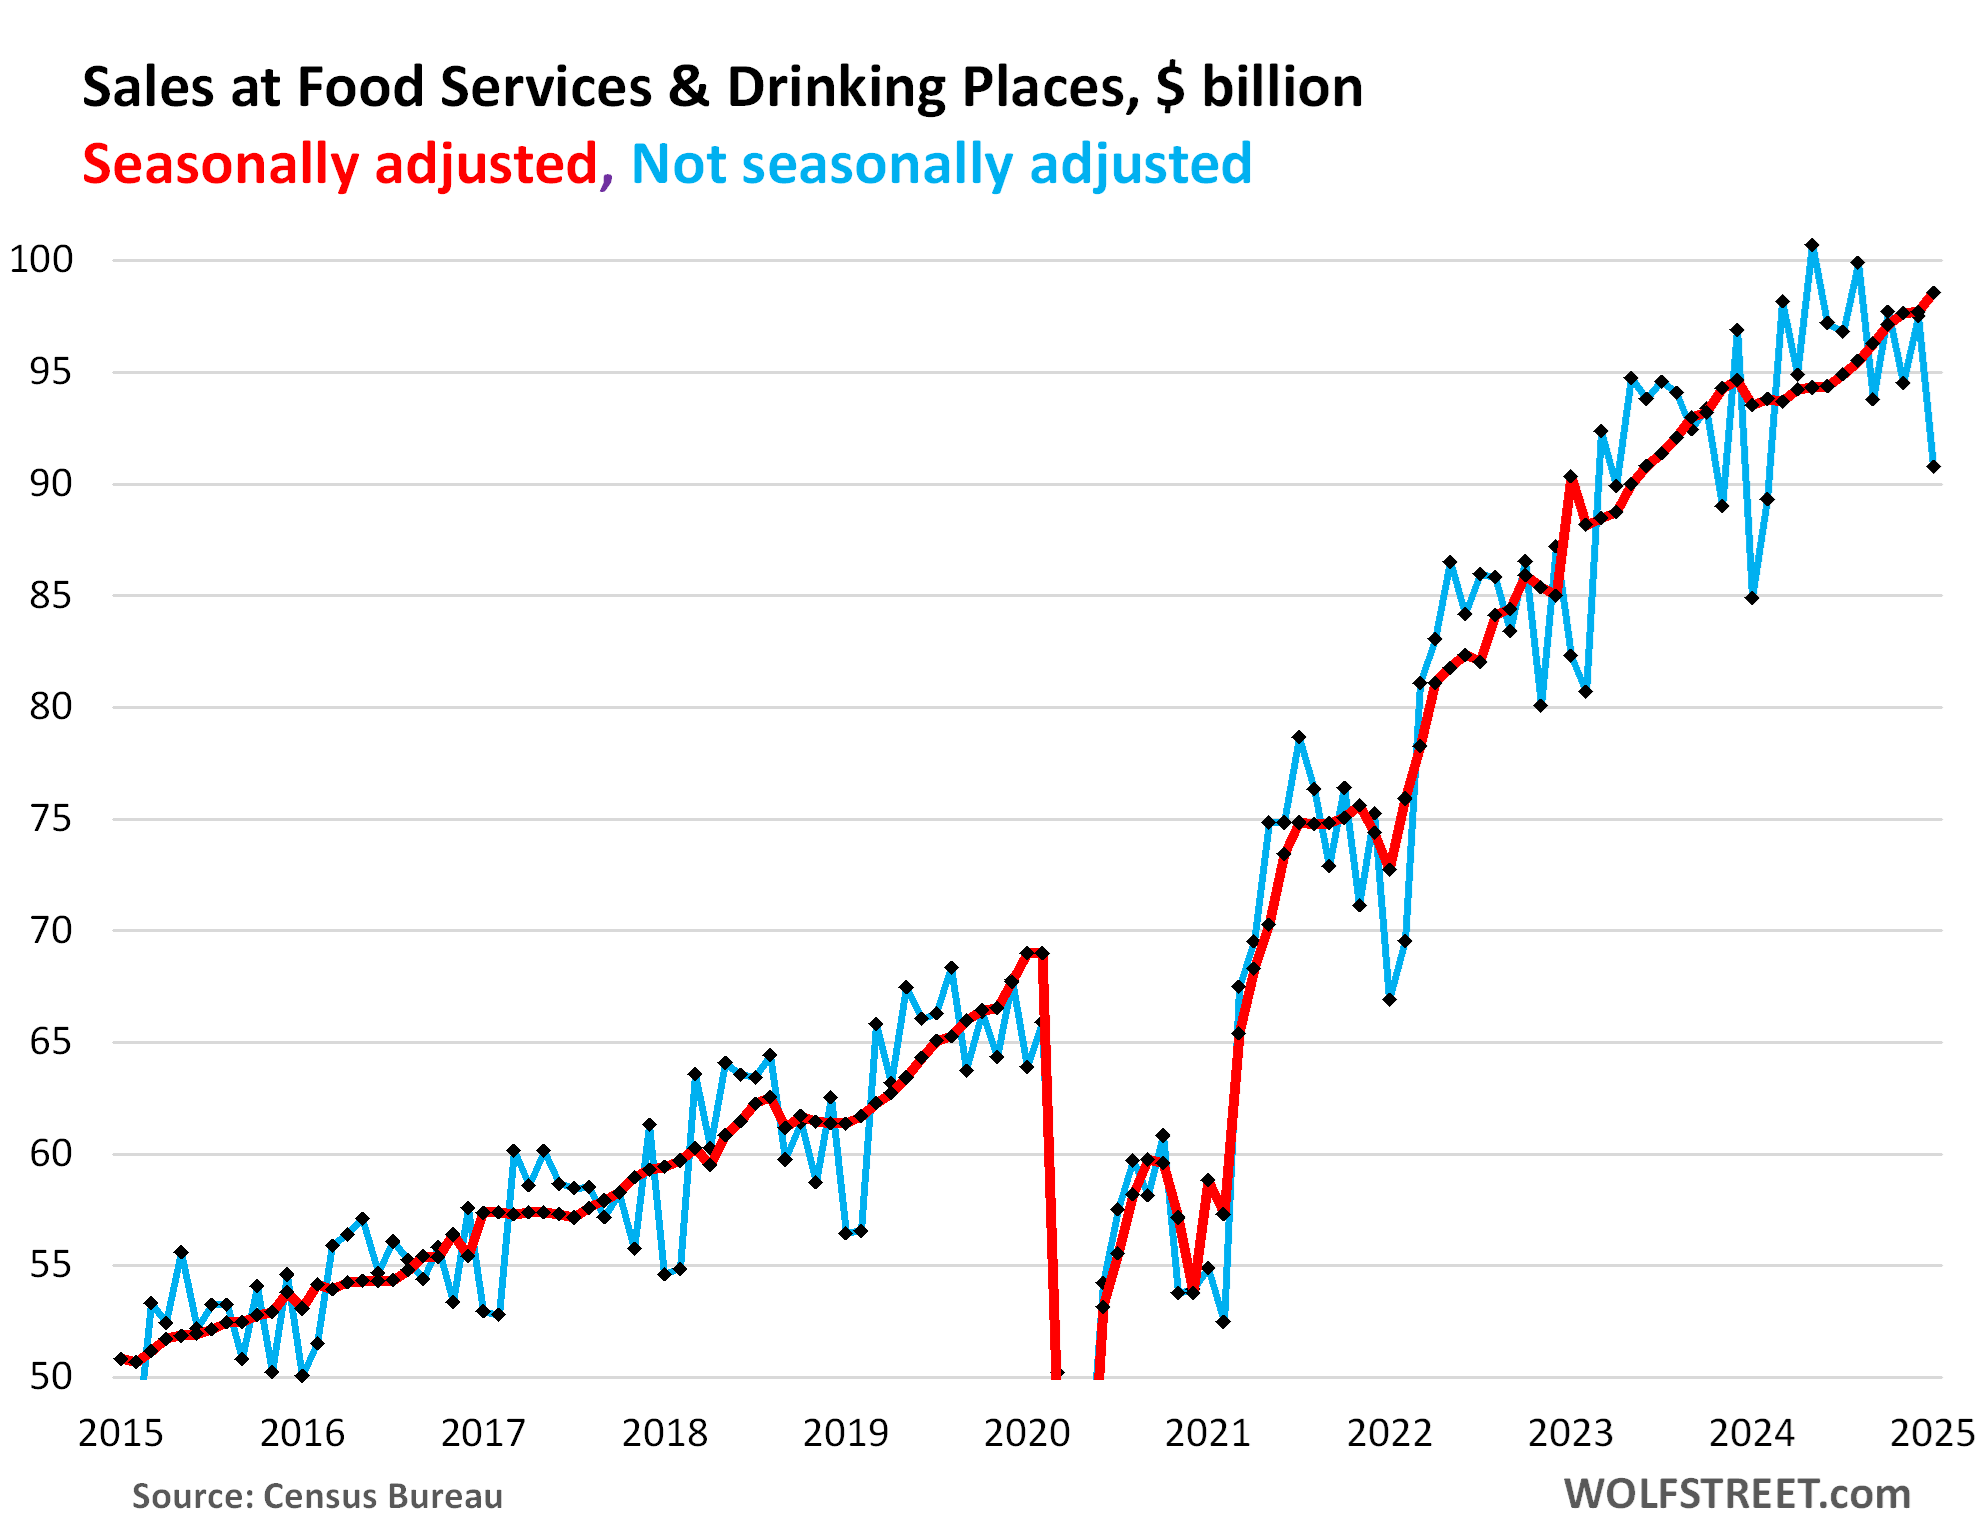
For food services & drinking places, late spring and summer are the best months, January and February are the worst.
This January:
- NSA: -6.9% month-to-month, but +6.9% year-over-year.
- SA: +0.9% month-to-month, and +5.4% year-over-year.
So what does this mean?
For most retailers, January always sucks. That’s kind of what this means. But this January, actual retail sales (NSA) sucked less than January a year ago, they were up 4.8% from a year ago, despite winter storms and whatnot. January and February retail sales data are never conclusive about the direction of consumer spending because the huge and erratic seasonality in those months makes it impossible to draw broader conclusions about the consumer. What I can say is that the retail sales data today doesn’t tell me to start worrying about the consumer, suddenly, after the huge record December.
Enjoy reading WOLF STREET and want to support it? You can donate. I appreciate it immensely. Click on the beer and iced-tea mug to find out how:

Would you like to be notified via email when WOLF STREET publishes a new article? Sign up here.
![]()
The post About that Retail Sales Plunge in the Headlines: A Romp through the Massive Seasonal Adjustments this Time of the Year appeared first on Energy News Beat.
“}]]