[[{“value”:”
The share of T-bills outstanding, average interest rate paid on the debt, and cash in the Government Checking Account (TGA).
By Wolf Richter for WOLF STREET.
Today, the US national debt jumped by another $61 billion and thereby made it over the $36-trillion mark, to $36.03 trillion, only four months after it had made it over the $35-trillion mark (July 26), and 11 months after it had made if over the $34-trillion mark (December 29), according to data from the Treasury Department today. Trillions are flying by so fast they’re hard to see.
So far this year, the national debt has ballooned by $2 trillion, despite GDP growth that has been well above the 15-year average. That’s the astounding thing, that the government has been racking up these huge debts despite the strongly growing economy. No one wants to even imagine how this debt would balloon if there’s ever a recession with falling tax receipts and surging outlays. It’s just nuts to have this during the good times (flat spots = Congressional debt-ceiling charades):

Debt “Held by the public.”
Of that $36.03 trillion in Treasury securities, $28.69 trillion are “held by the public” in accounts in the US and around the world, in brokerage accounts, by banks, by insurance companies, at financial centers, by central banks, by the Fed, etc., and these securities can be traded in the market.
The remaining $7.34 trillion of the debt are held in federal government pension funds, the Social Security Trust Fund, and other “internal” government accounts, and they’re not traded.
It’s that $28.69 trillion that the government must find buyers for, even as the Fed has been unloading its Treasury holdings as part of QT, having by now gotten rid of $1.43 trillion in Treasury securities.
Investors are enticed to buy Treasury securities because of the yield, and if they lose interest and stop buying, the yield rises until more investors find it appealing and buy. So there will always be demand for US Treasury securities, but the yield may be higher, which eventually becomes a problem for the government because it has to pay the interest.

Foreign investors backed up their trucks and loaded up.
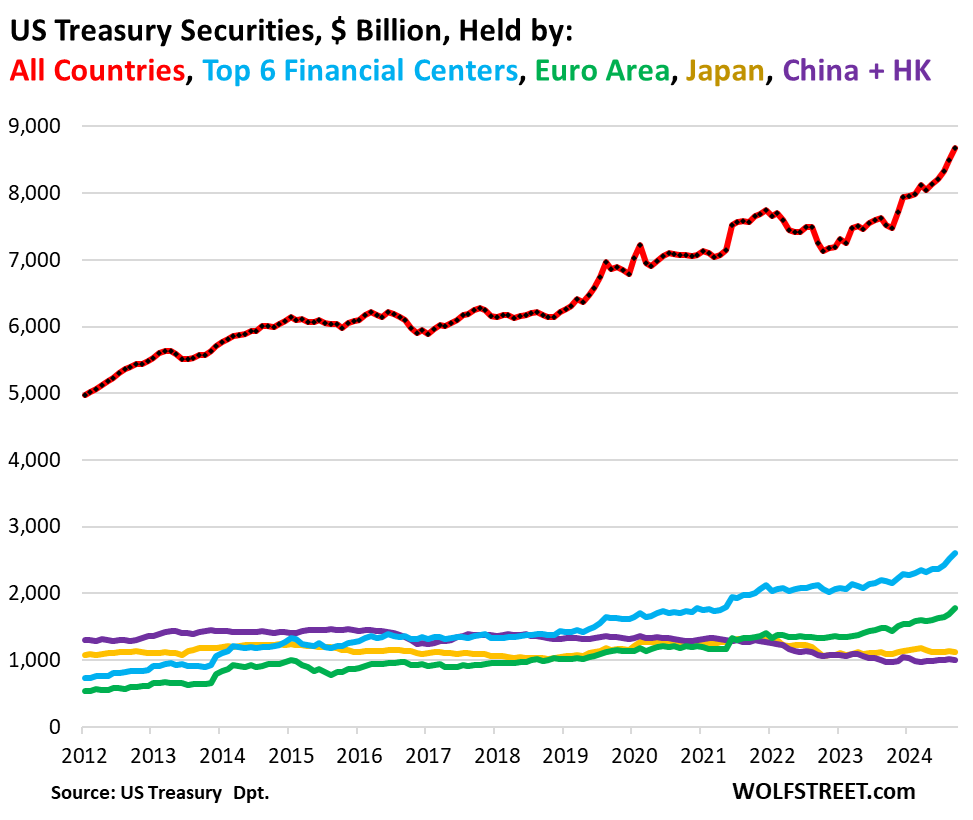
In September, all foreign investors combined (red in the chart below) added $170 billion to their holdings of US Treasury securities – well over half of that increase was by the Euro Area – bringing their holdings to a record $8.67 trillion.
Over the past 12 months, they increased their holdings by $880 billion, or by 15.4%! China and Japan, which have been shedding their holdings, have been replaced by eager buyers in Europe, the UK, India, Canada, Taiwan, in financial centers, etc. (detailed discussion and charts by country here):

The share of Treasury bills.
The amount of Treasury bills outstanding (securities with terms of 1 year or less) rose to a record $6.19 trillion by October 31. Nearly all of them are held by the public.
The T-bills’ share of the debt held by the public was 22.1% at the end of October and has been around 22% all year. During crisis periods, the share was higher: In June 2020, it peaked at 25.5%, and November 2008, after the Lehman Brothers bankruptcy, it peaked at 34.4%. During a crisis, there is a lot of demand for T-bills as secure liquid place to put a lot of cash. The government ramps up auction sales to meet that demand and rake in the cash that it can then blow on bailouts and stimulus payments.
The Fed holds only $195 billion in T-bills but has said that it would gravitate back to more T-bills, from notes and bonds, over the next many years, which was the old normal before 2008.
Possibly in preparation for whatever, Buffett decided to T-bill and Chill, tripling his T-bill holdings in two years to $325 billion. Lots of demand for T-bills, and lots of T-bills:

To replenish the checking account? Nope.
Replenishing the government’s checking account – The Treasury General Account at the New York Fed – was not the reason the debt ballooned because the TGA balance has remained roughly unchanged all year. It actually dipped a little from $743 billion at the start of the year to $738 billion currently.
The periodic debt-ceiling charades in Congress lead to the TGA getting drained perilously close to zero. After the charade concludes, the government replenishes the TGA by borrowing huge amounts. But that hasn’t happened this year. Since about October 2023, the TGA has been roughly at the current level.
So those $2 trillion in increased debt this year actually were spent and went out the door.

The Debt-to-GDP ratio, ugh.
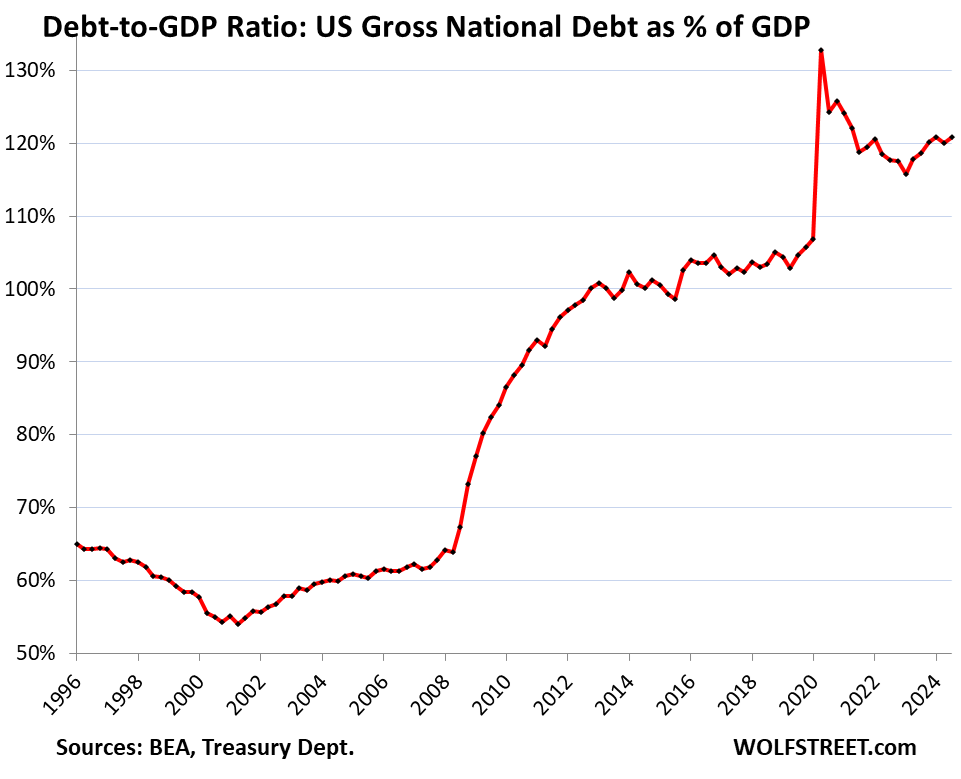
In the third quarter, the US debt-to-GDP ratio ticked up to 120.8% despite the strong growth of GDP, but the debt grew even faster:

The burden of interest payments spiked.
The relevant metric is interest payments as a percentage of tax receipts that are available to pay for the interest (this excludes contributions to Social Security, Medicare, etc., that go directly into the respective trust funds to pay beneficiaries). The BEA provides the relevant measure of tax receipts on a quarterly basis.
The ratio of interest payments as a percentage of tax receipts in Q2 rose to 36.3%, the highest since 1997 – the extent to which interest payments ate up the national income. We’re now eagerly awaiting the Q3 data.

The average interest rate on this debt.
In October, the average interest rate that the Treasury Department paid on its total debt, as new securities replaced maturing older securities, dipped to 3.30%, the second month in a row of declines, and still fairly low by historical averages. But the last few months were the highest since 2010:

Enjoy reading WOLF STREET and want to support it? You can donate. I appreciate it immensely. Click on the beer and iced-tea mug to find out how:
Would you like to be notified via email when WOLF STREET publishes a new article? Sign up here.
![]()
The post US National Debt Goes Over $36 Trillion, +$2 Trillion in 2024!! 🥂🍾 appeared first on Energy News Beat.
“}]] 

